Design and Development of a Portable Water Quality Monitoring Device for Real-Time Assessment
Real-Time Measurement and Analysis for Critical Parameters such as pH, Turbidity, Temperature, and TDS
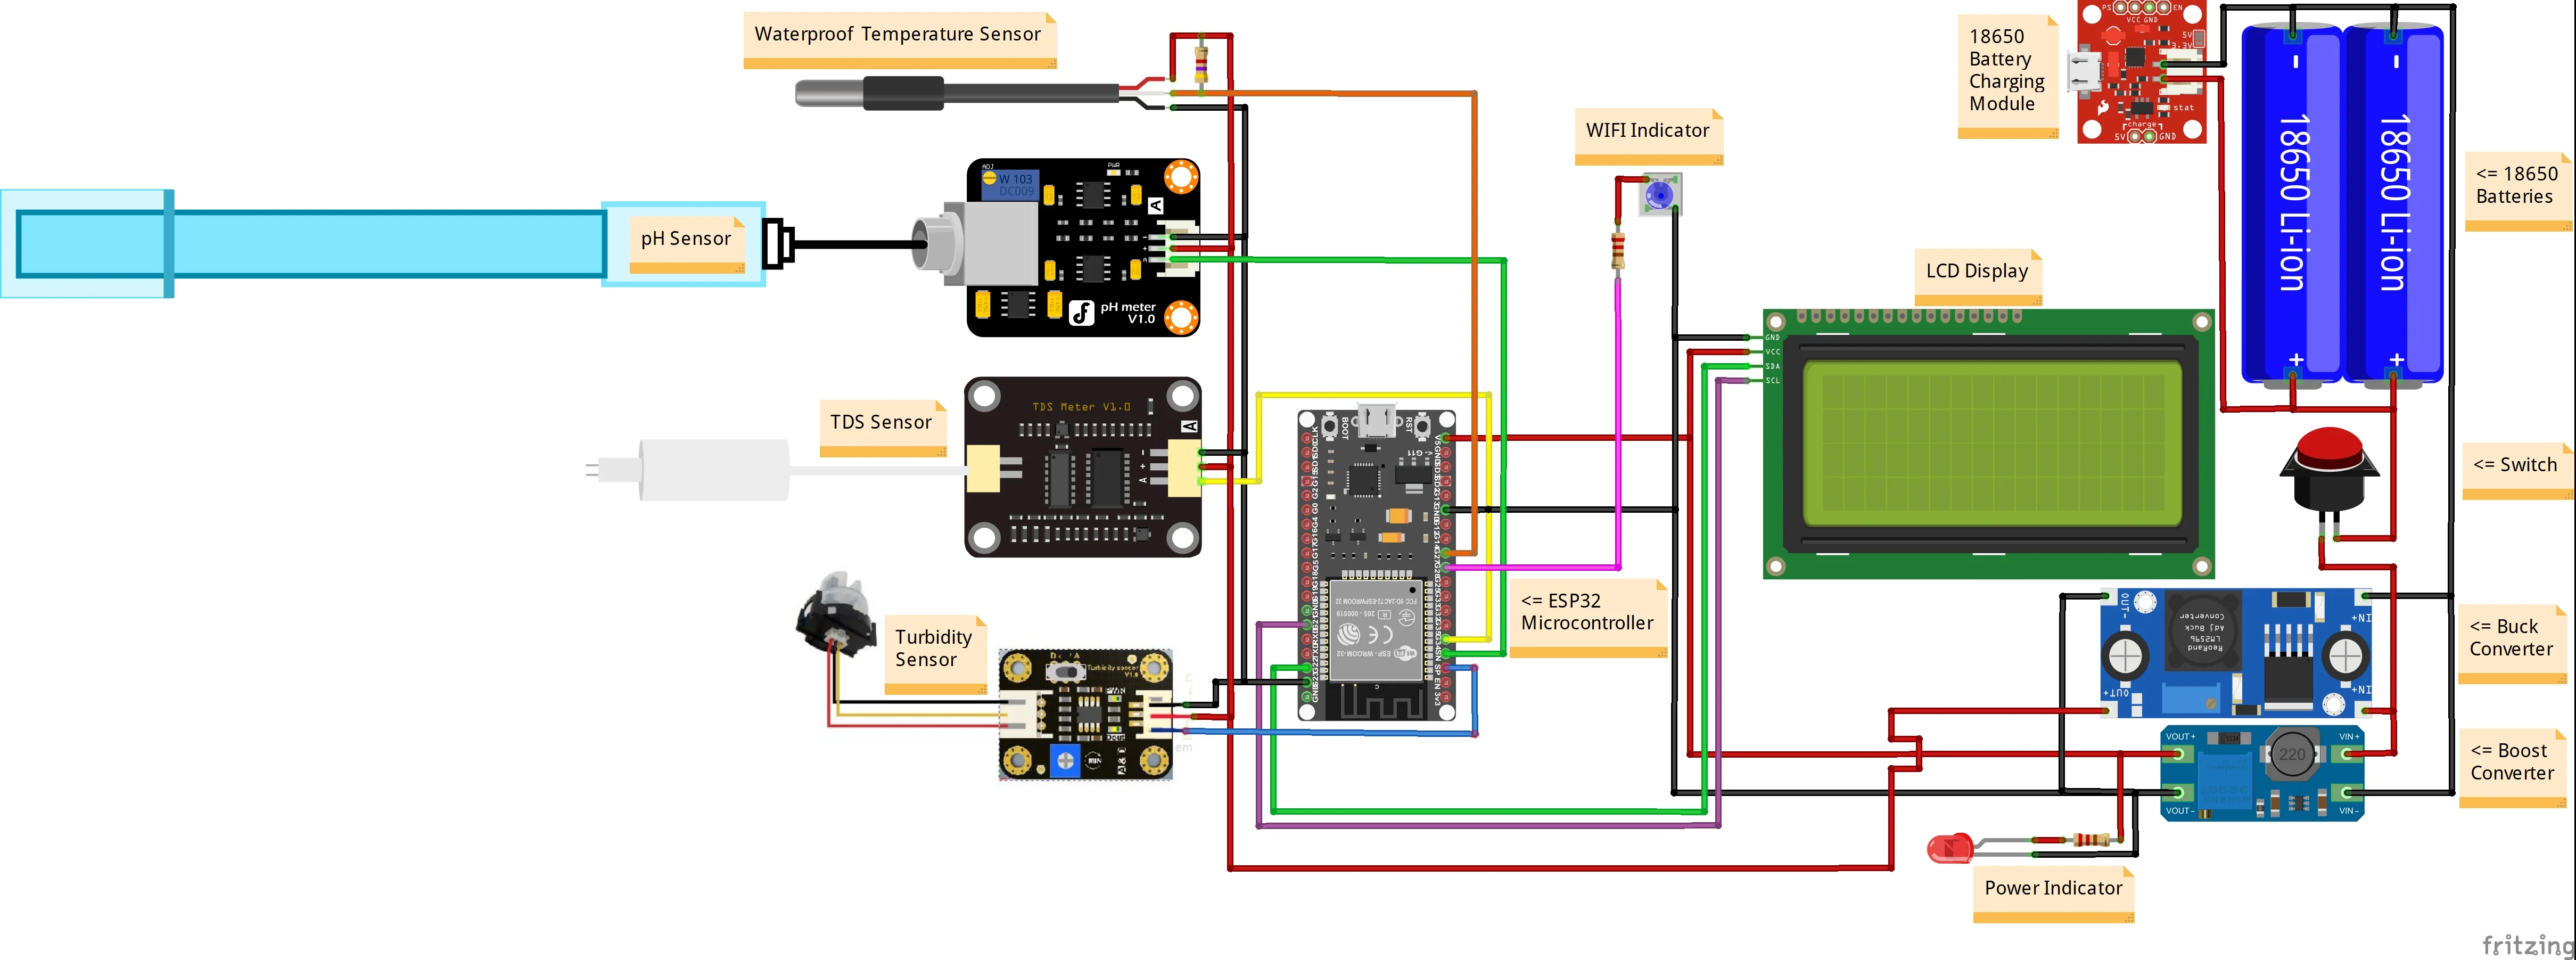
Tools & Technologies: ESP32 Microcontroller, pH Sensor, TDS Sensor, Waterproof Temperature Sensor, Turbidity Sensor, Liquid Crystal Display (LCD), Charging module, LED indicator, 18650 Lithium-Ion Batteries, Boost Converter, Mobile Application (BLYNK), Fritzing for Circuit Design, Arduino IDE for Programming.
Status: Completed
Introduction
This project addresses the critical need for portable, reliable, and cost-effective water quality monitoring solutions, particularly in regions with limited access to traditional testing facilities. By integrating multiple sensors into a compact handheld device, this innovation enables real-time assessment of key water quality parameters, including pH, turbidity, temperature, and total dissolved solids (TDS). Designed with user-friendly interfaces and IoT capabilities, the device bridges the gap between accessibility and advanced technology for improved public health outcomes.
System Overview
Aim and Objectives
Aim:
To develop a portable and user-friendly water quality monitoring
device capable of real-time assessment and accurate reporting of critical parameters.
Objectives:
The objectives of the project are outlined below:
- Measure pH, turbidity, temperature, and TDS with high accuracy.
- Provide a user-friendly interface via an LCD and mobile application (BLYNK).
- Integrate data processing and visualization for real-time decision-making.
- Validate the device's performance under laboratory and field conditions.
Features & Deliverables
- Comprehensive Monitoring: Simultaneously measures pH, turbidity, temperature, and TDS.
- Real-Time Data Access: Results are displayed on an LCD and synced with a mobile app.
- Portability: Compact design powered by a rechargeable battery system.
- IoT Integration: Wireless connectivity for remote monitoring and control via BLYNK.
- Ease of Use: Designed for non-technical users with simple interfaces and robust performance.
List of Libraries Used and Custom Code Implementations
- BLYNK Libraries: (#include <WiFiClient.h> #include <BlynkSimpleEsp32.h>) For real-time data transmission to the mobile and web application.
- Liquid Crystal Display Libraries: (#include <Wire.h> #include <LiquidCrystal_I2C.h>) For managing the I2C-based LCD interface.
- Dallas Temperature Sensor Library: #include <OneWire.h>, #include <DallasTemperature.h> For communicating with and reading data from DS18B20 and other one-wire temperature sensors.
- TDS Sensor Data Handling with Custom Code: For reading analog data and performing calculations to measure Total Dissolved Solids (TDS) in water.
- Turbidity Sensor Data Handling with Custom Code: For reading analog data and processing it to measure the turbidity (clarity) of water.
- pH Sensor Data Handling with Custom Code: For reading analog data and converting it to determine the pH level of a solution.
Note: The "Data Handling with Custom Code" mentioned above refers to explicit code implementations created to handle data from their respective sensors. These are not prebuilt libraries but custom logic tailored for specific sensor functionality. In contrast, other components rely on dedicated libraries for their operations.
Pinout Diagram & GPIO Pin Usage
The following is the pinout diagram for the ESP32 Development Board. Refer to it while recreating or designing, along with the GPIO pins utilized in the project.
Pinout Diagram: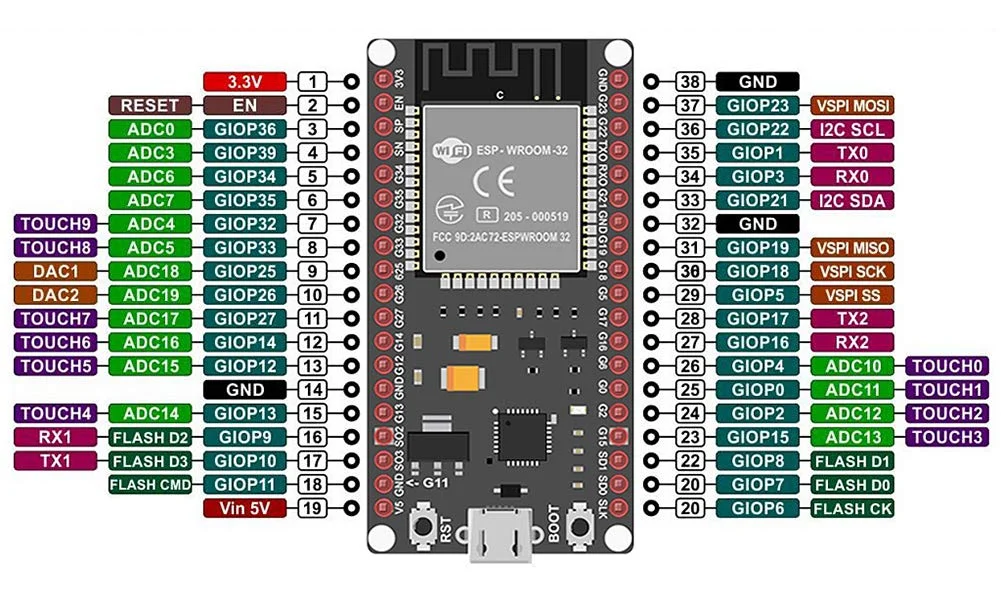
GPIO Pins Used:
| GPIO Pin | Component | Description |
|---|---|---|
| GPIO 39 | pH Sensor | Reads pH values. |
| GPIO 36 | Turbidity Sensor | Reads water clarity. |
| GPIO 27 | Temperature Sensor | Measures water temperature. |
| GPIO 34 | TDS Sensor | Measures total dissolved solids. |
| GPIO 21 | LCD (SDA) | I2C communication for data display. |
| GPIO 22 | LCD (SCL) | I2C clock signal for data display. |
| GPIO 26 | WiFi LED Indicator | Shows the status of WiFi connectivity. |
This layout emphasizes the efficient and structured utilization of GPIO pins to ensure smooth functionality.
Process / Methodology
Hardware Implementation
Components Used: ESP32 Microcontroller, pH Sensor, TDS Sensor, Waterproof Temperature Sensor, Turbidity Sensor, Liquid Crystal Display (LCD), 18650 Lithium-Ion Batteries, Boost Converter, Charging module, and LED indicators.
Functions of the Components Used- ESP32 Microcontroller: Acts as the central processing unit, coordinating sensor data acquisition and communication with the LCD and mobile application.
- pH Sensor: Measures the acidity or alkalinity of water for quality assessment.
- TDS Sensor: Evaluates the total dissolved solids, providing insights into water purity.
- Waterproof Temperature Sensor: Accurately monitors water temperature under various environmental conditions.
- Turbidity Sensor: Assesses water clarity by detecting suspended particles
- Liquid Crystal Display (LCD): Displays real-time readings for easy user interpretation.
- 18650 Lithium-Ion Batteries: Provide portable and rechargeable power for the device.
- Boost Converter (XL6019): Steps up the battery voltage to match the operational requirements of the system.
- Charging Module: Manages safe recharging of the batteries, preventing overcharging or damage.
- LED Indicators: Provide visual feedback for power status, operational modes, and WIFI status.
- The sensors are interfaced with the ESP32 microcontroller using appropriate analog and digital pins, ensuring precise data capture.
- The LCD module is connected in I2C mode to display real-time measurements from the sensors.
- 18650 batteries are connected in parallel to provide extended power capacity, with the boost converter ensuring a stable voltage supply to all components.
- The charging module is incorporated to allow easy recharging of the device, with LED indicators signaling charging status.
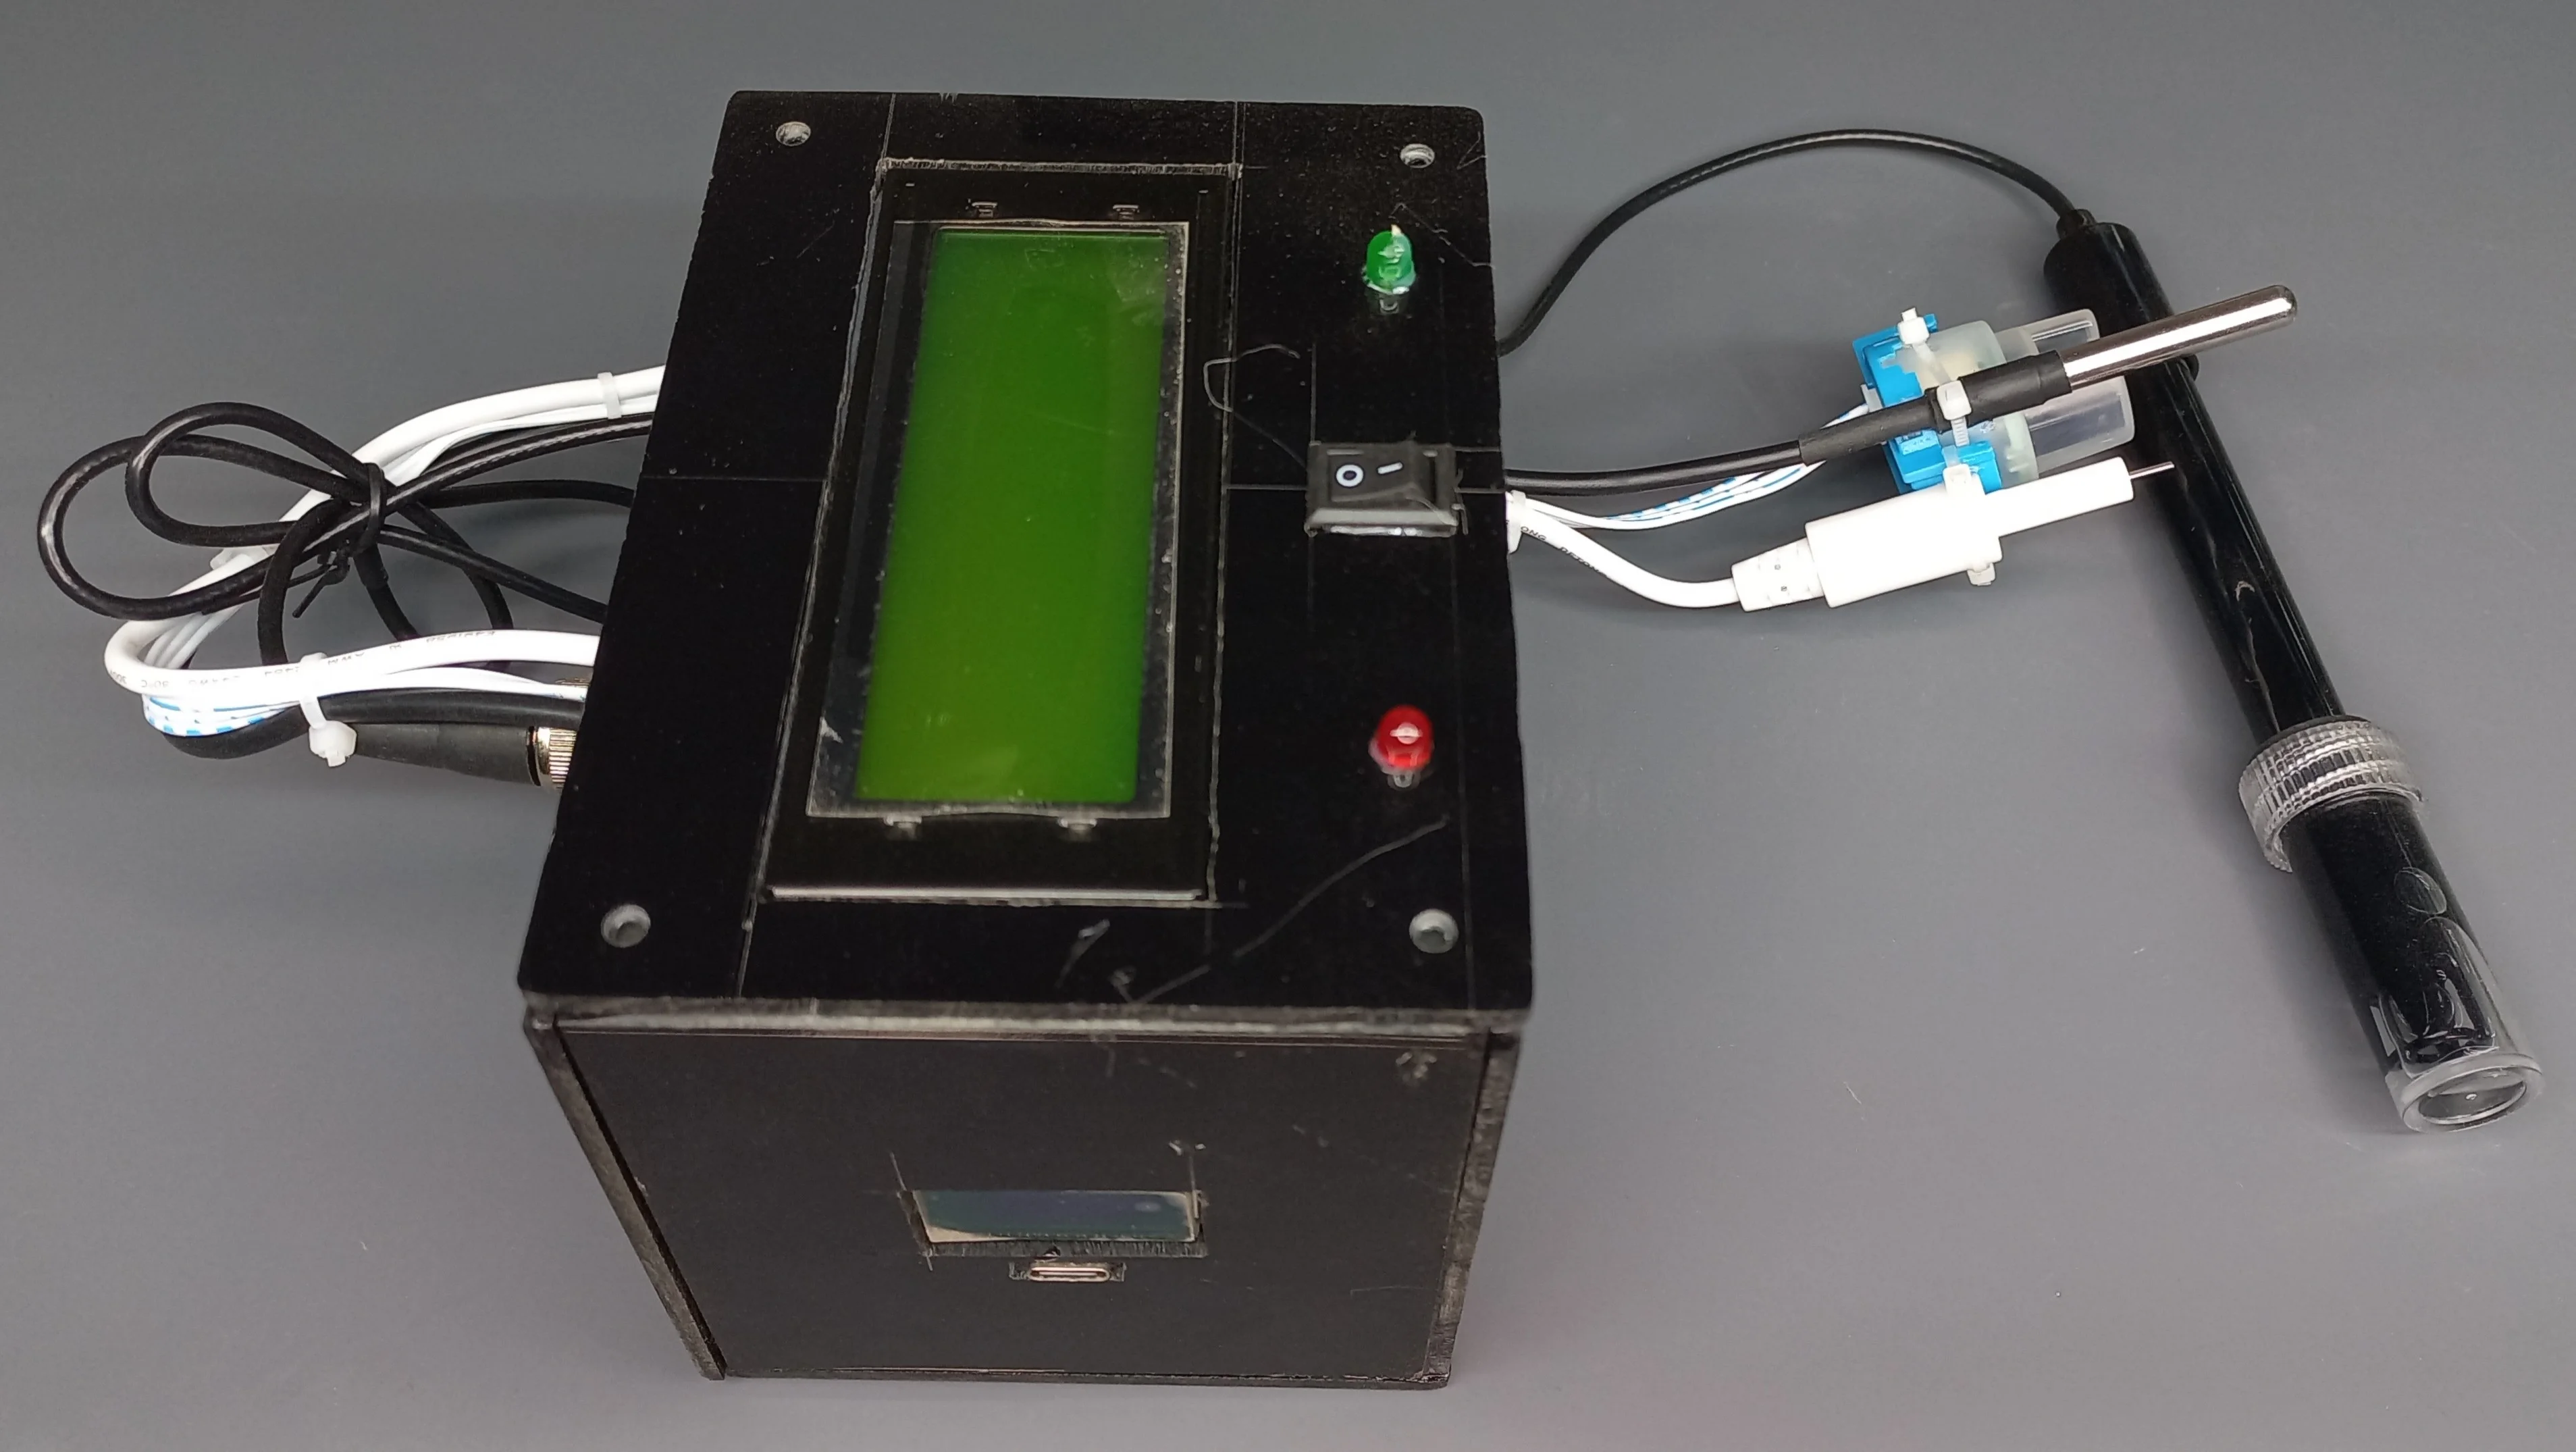
- The entire system is mounted on a veroboard and housed in a durable casing, maintaining portability and protecting internal components.
Hardware Assembly
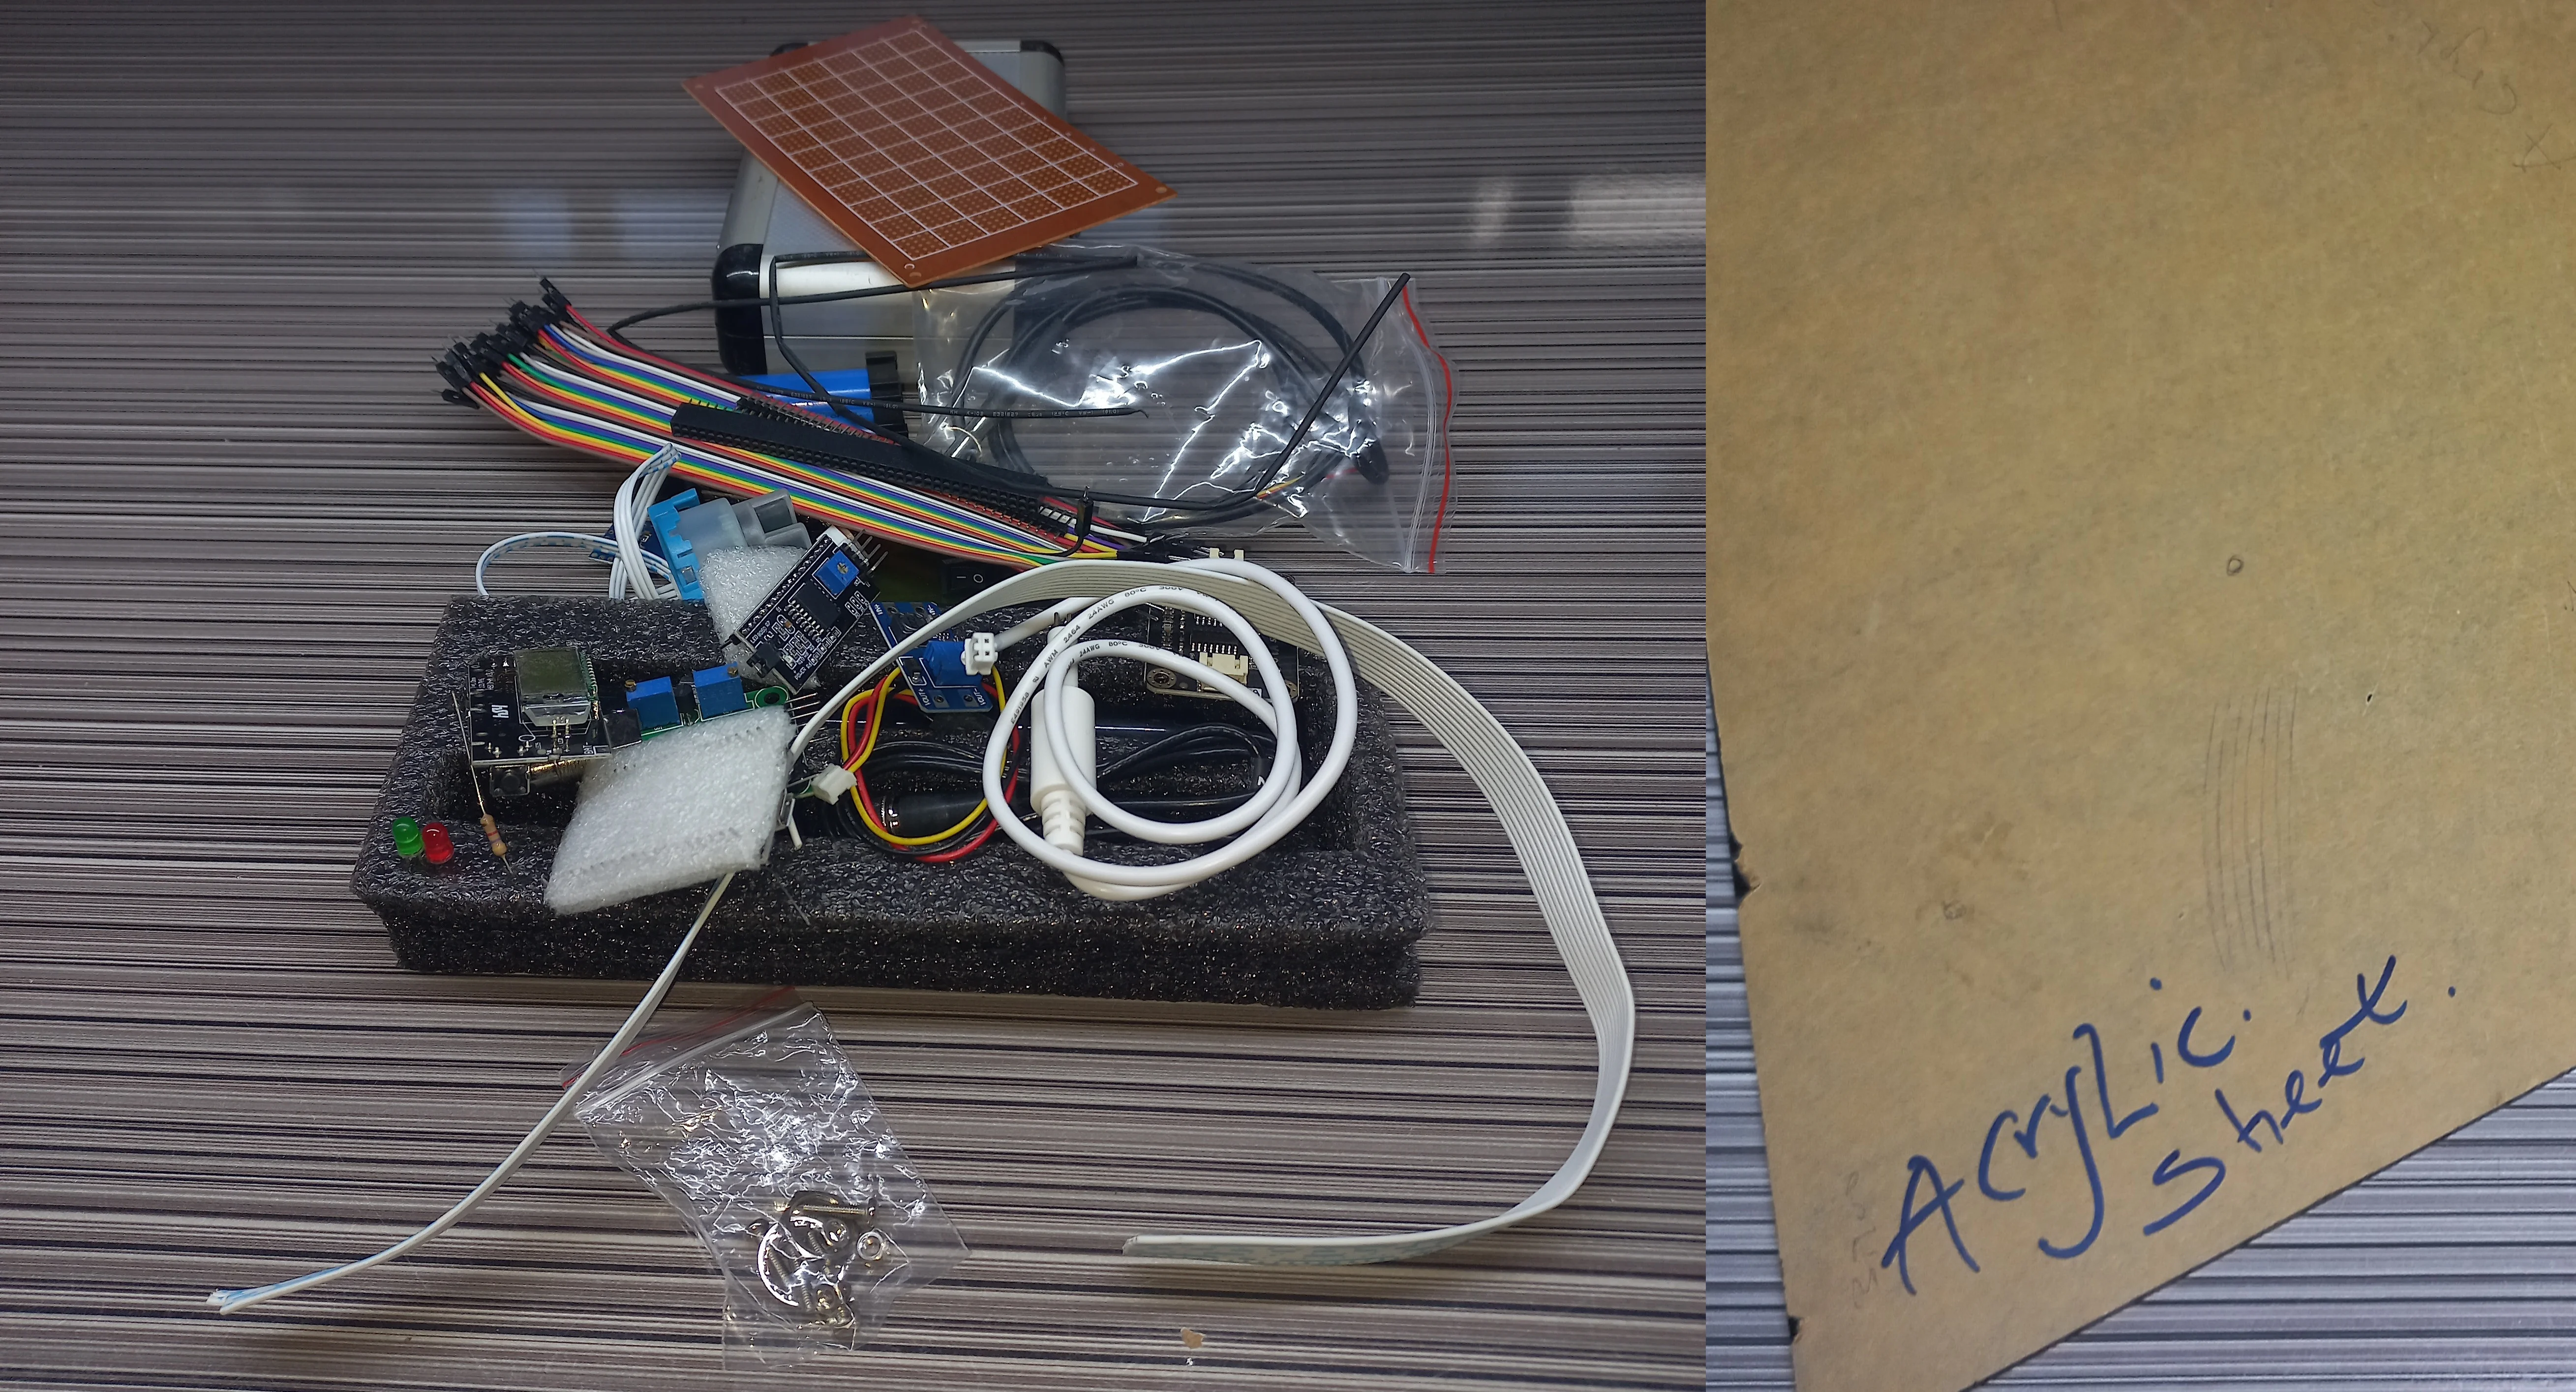
All Components
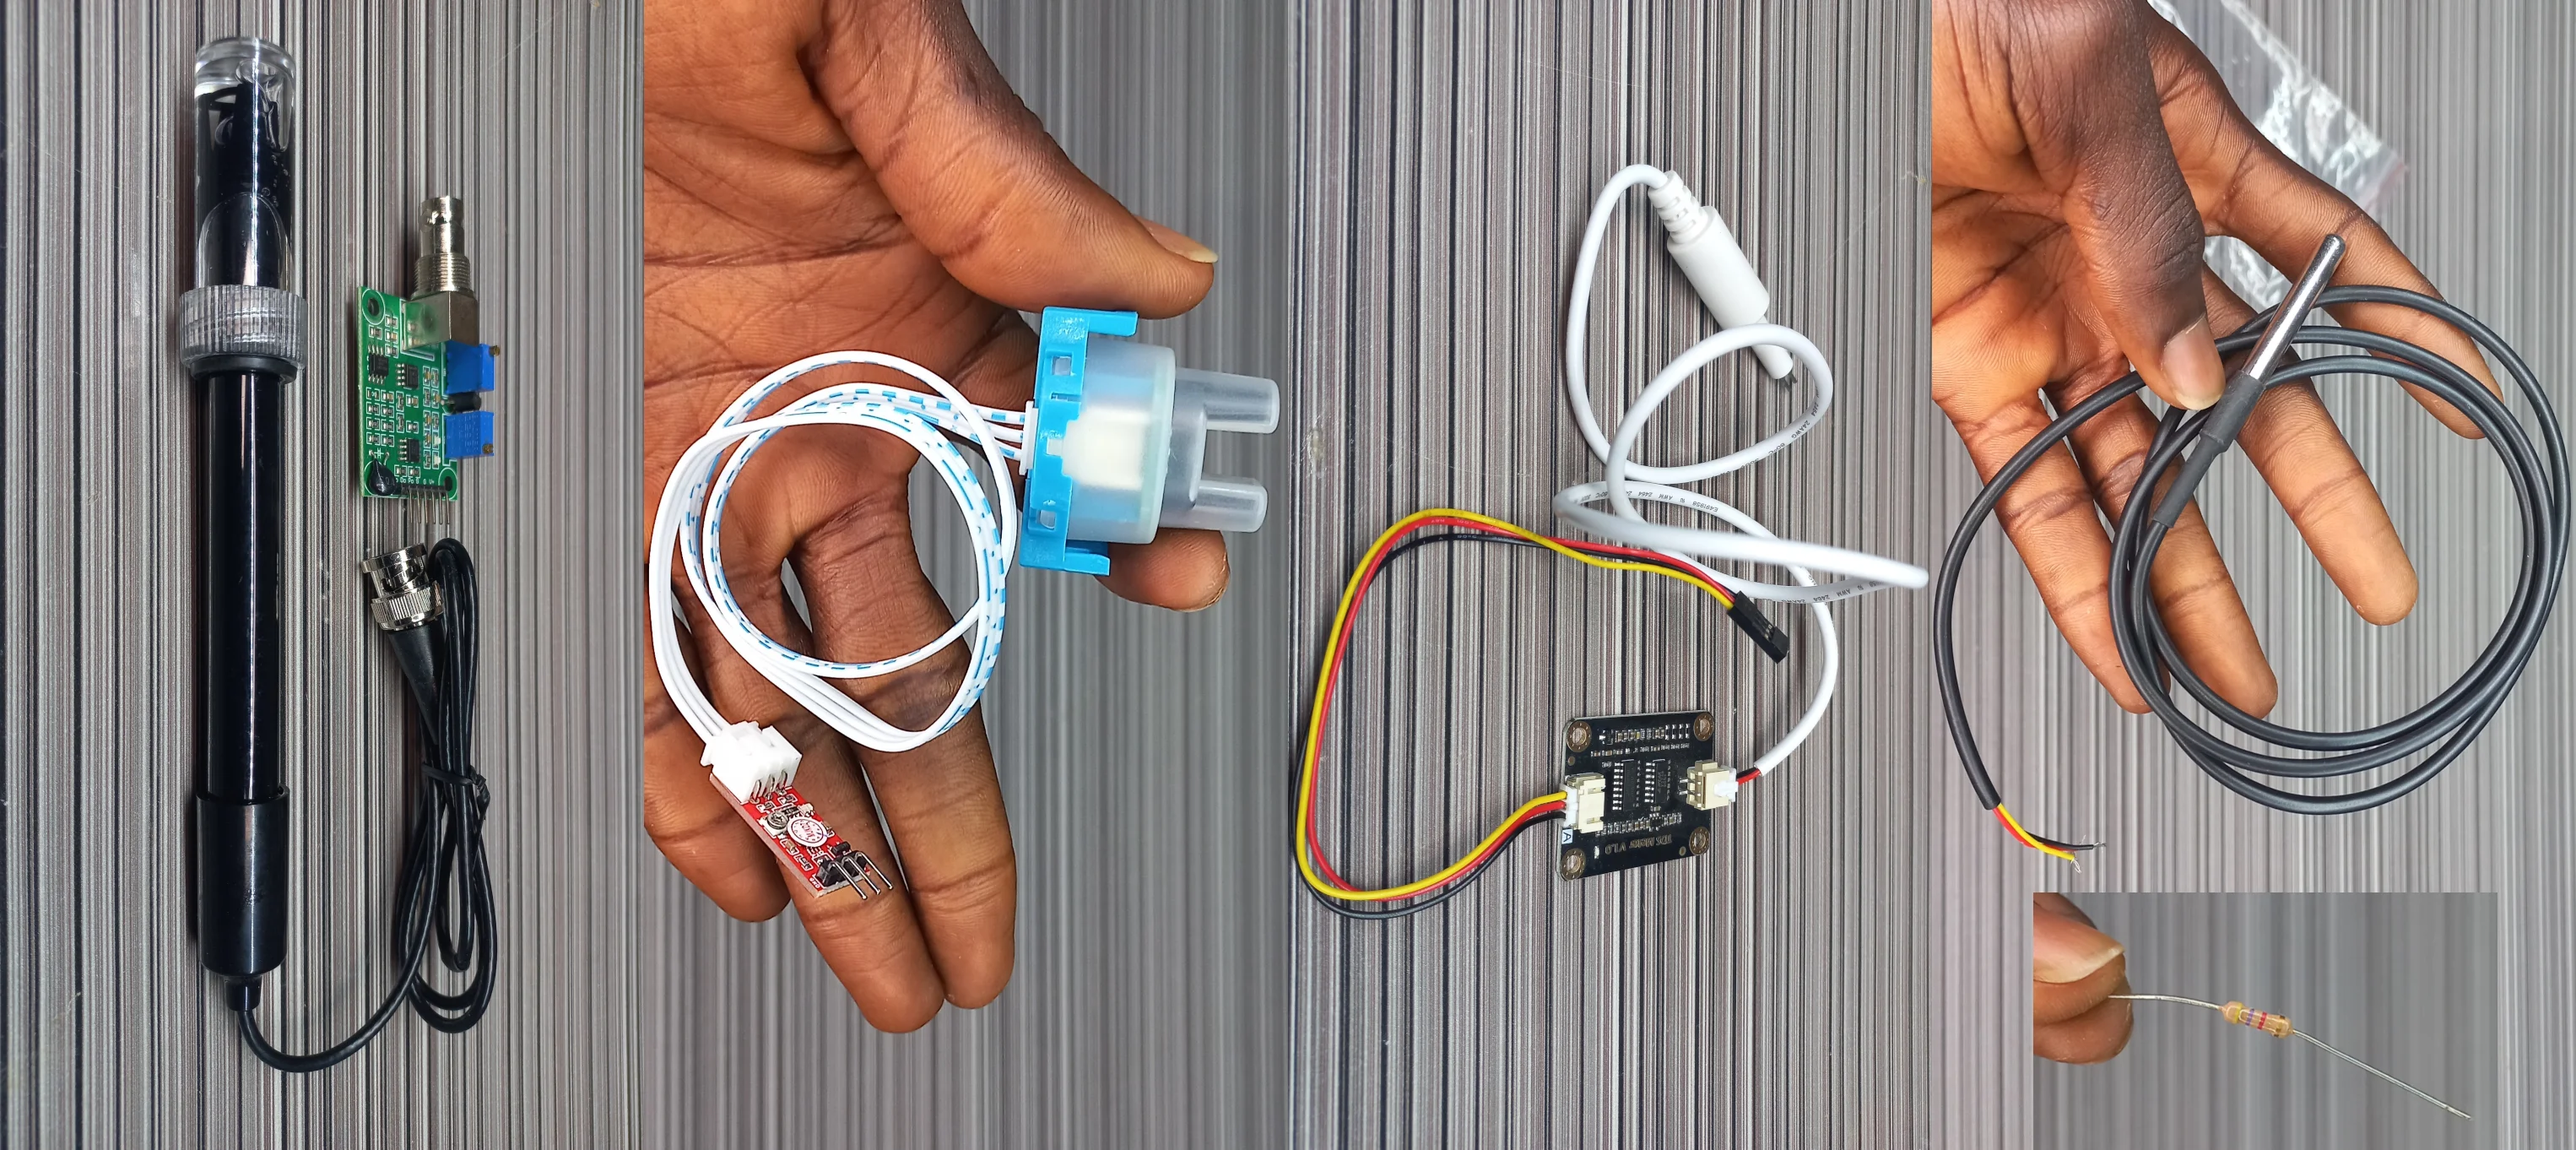
 pH, Turbidity, TDS, and Temperature Sensors with its 4.7k ohm resistor
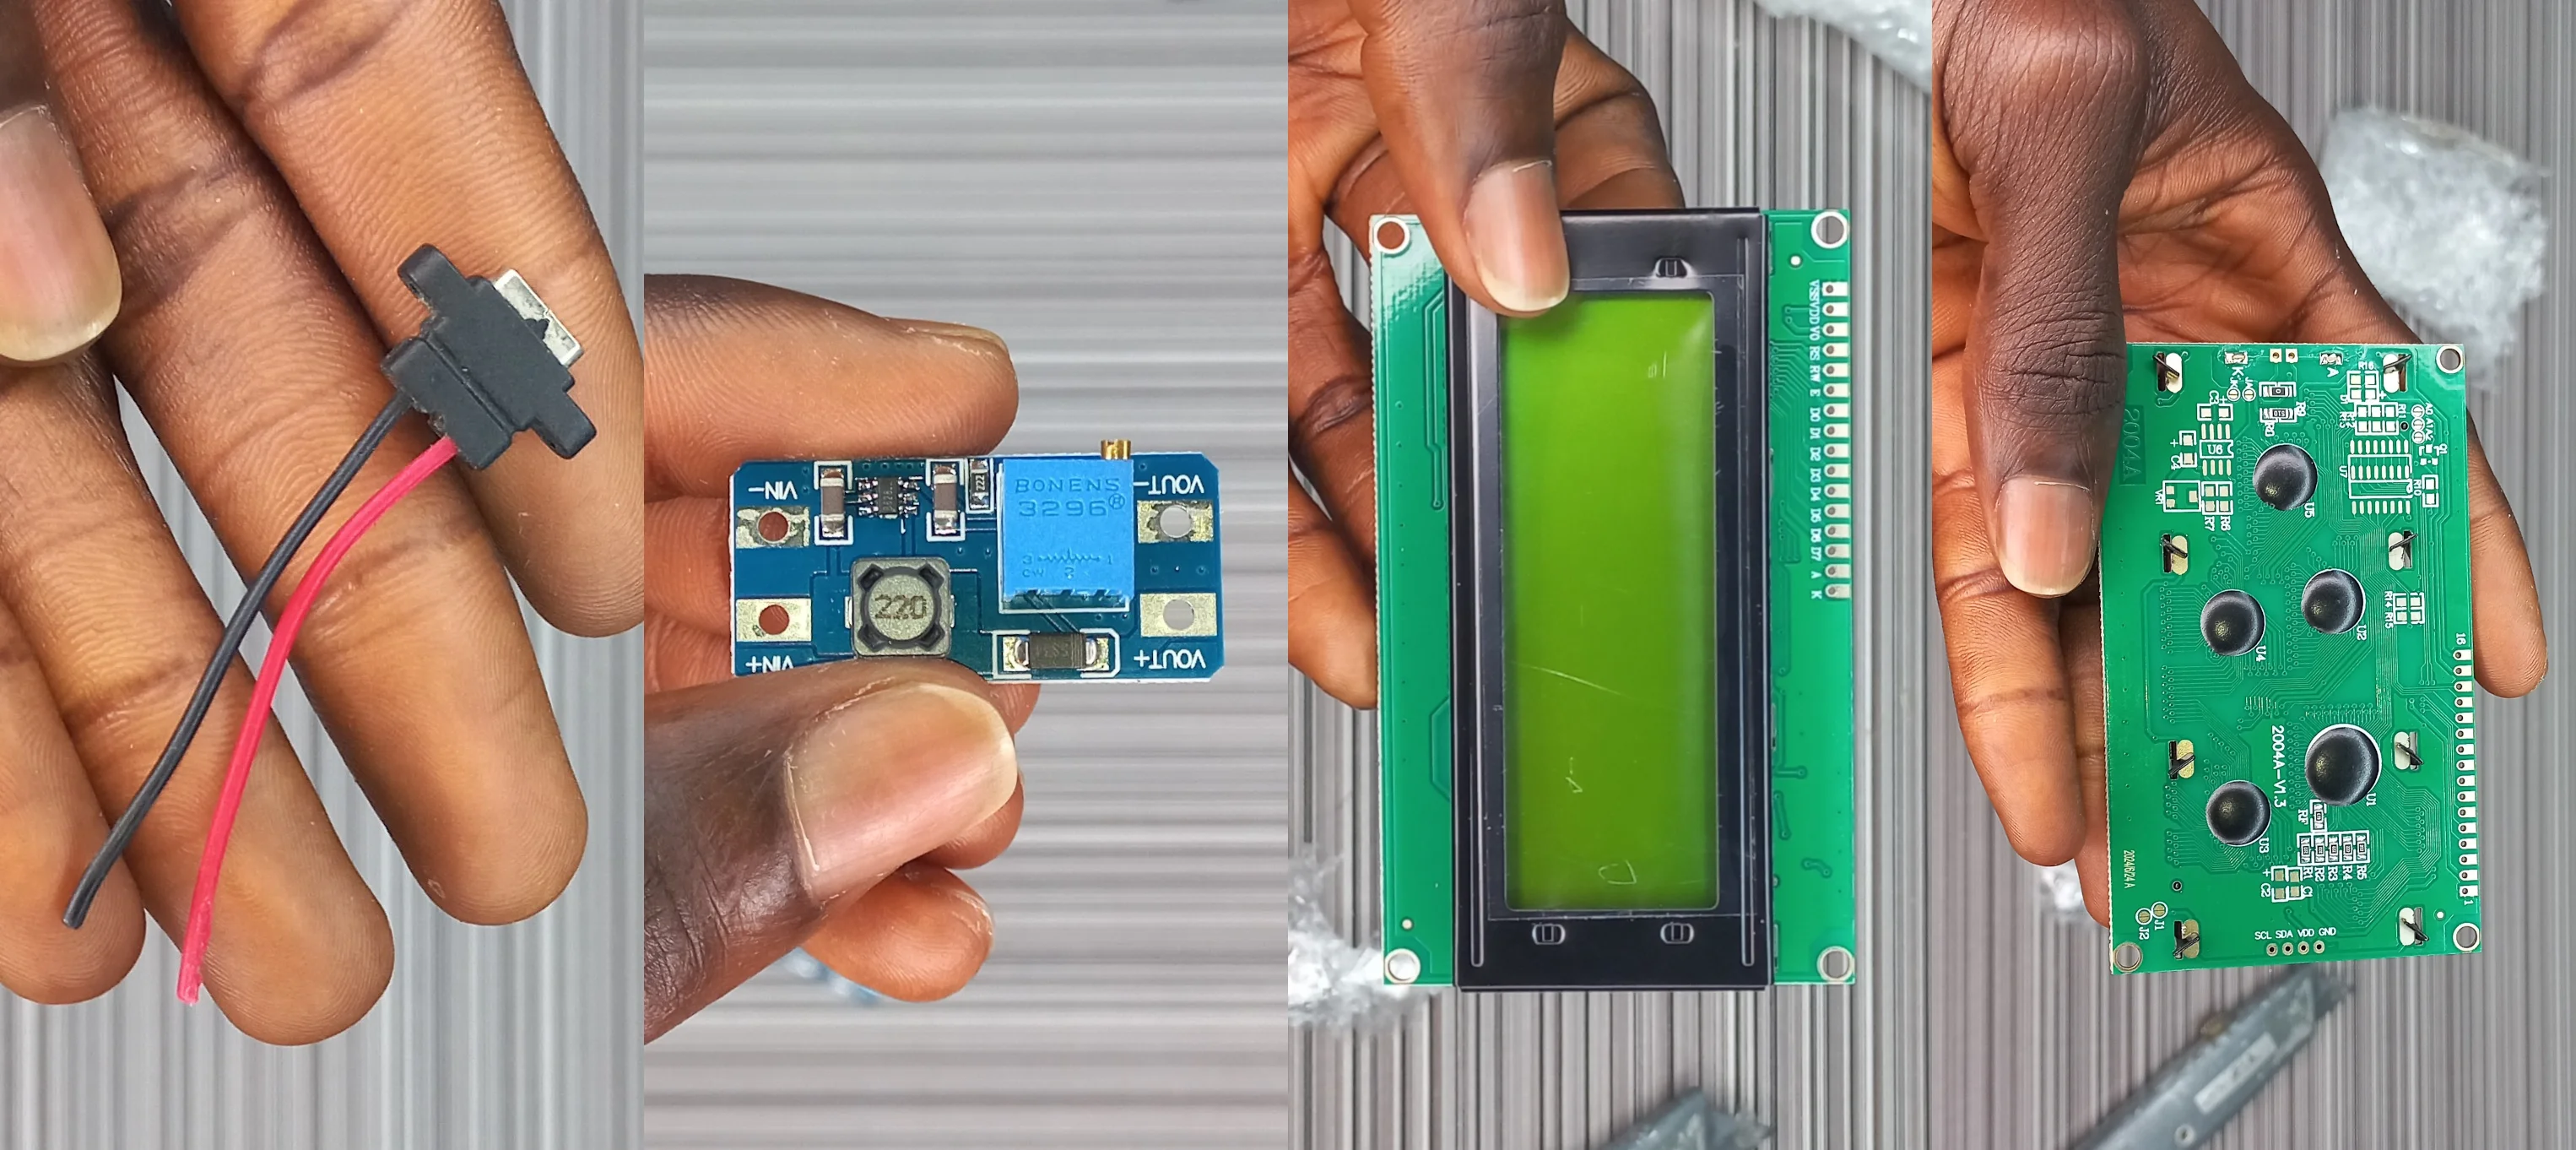
 Type C Charging Port, Boost Converter, and LCD (front & back)
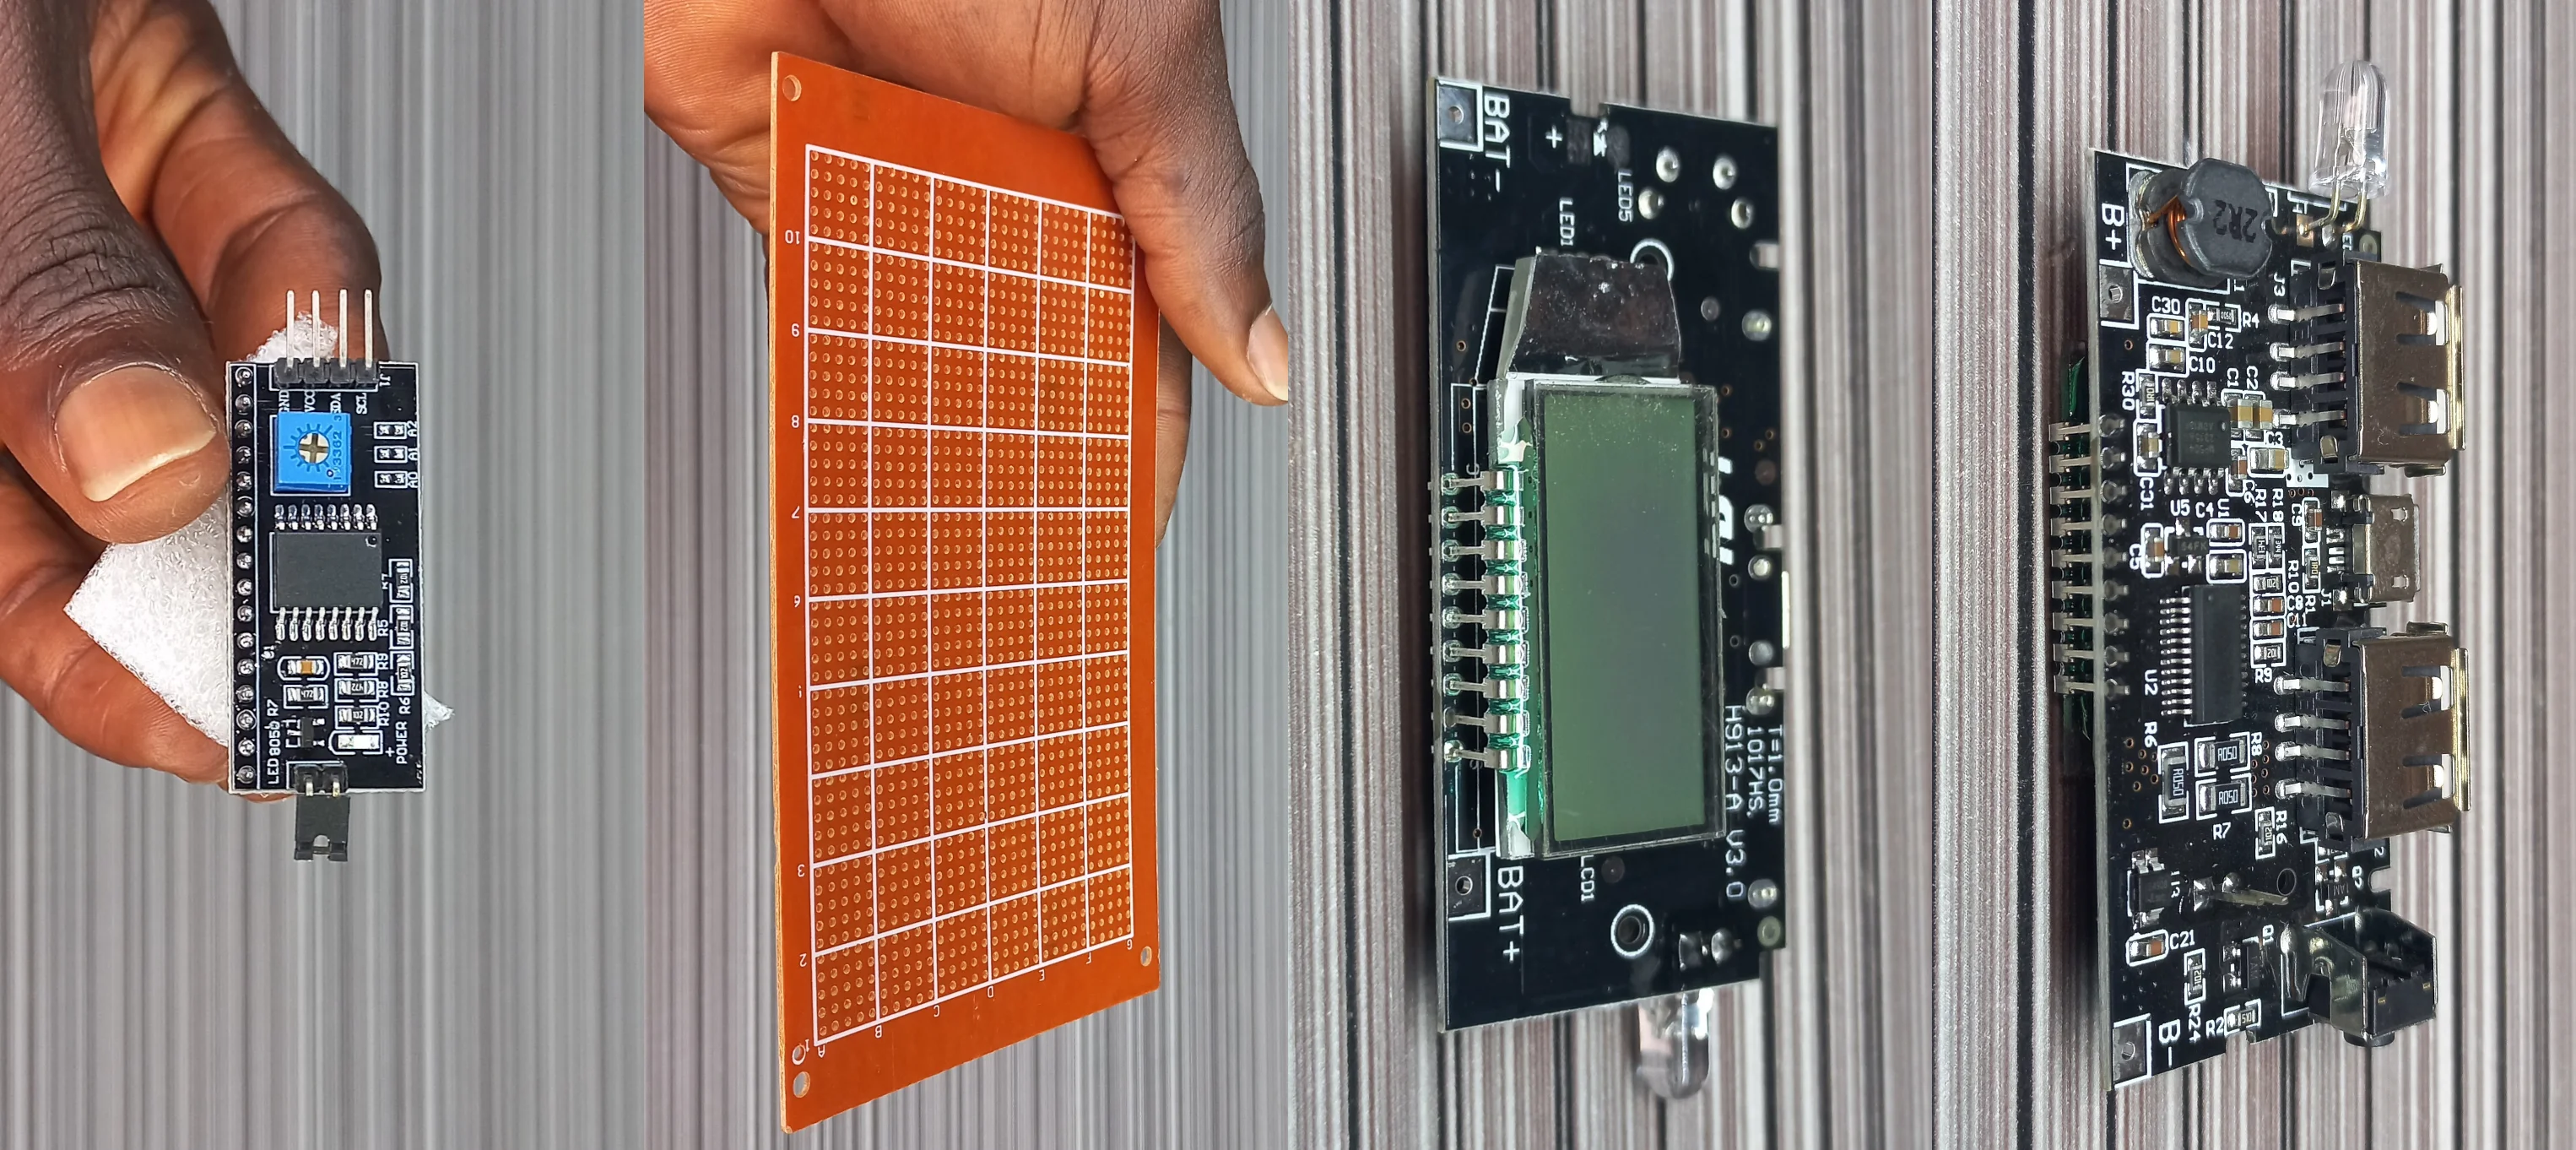
 I2C for LCD, Veroboard, and 18650 Battery Charging Module (front & back)
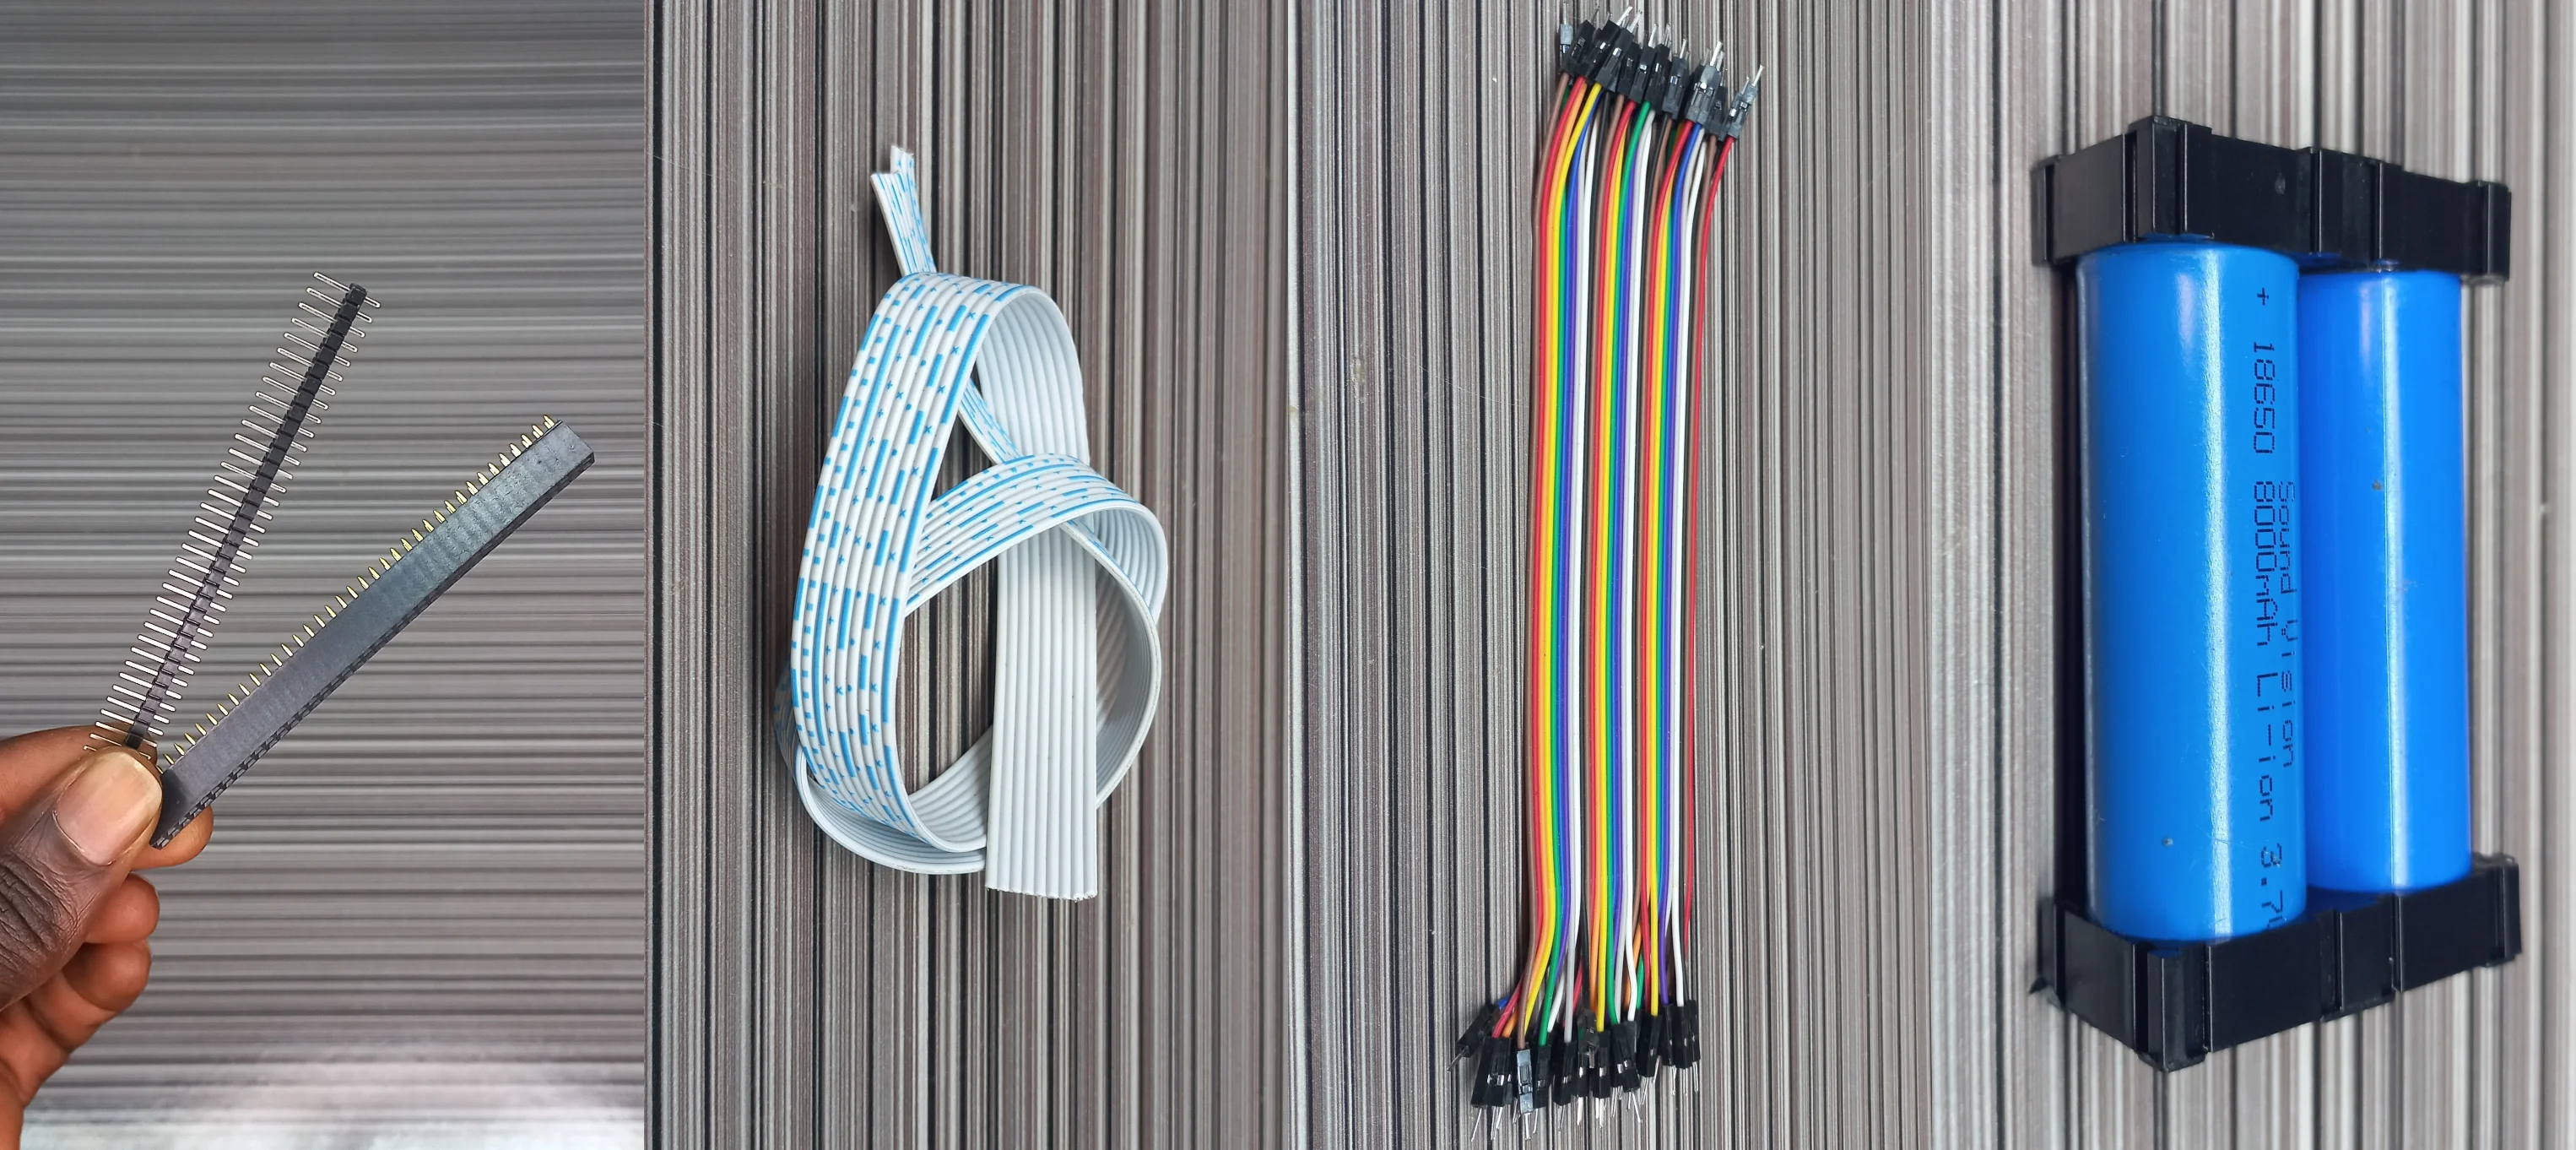
 DIL Connector, Ribbon Cables, Jumper Cables (male to male), and 18650 Lithium
Batteries
DIL Connector, Ribbon Cables, Jumper Cables (male to male), and 18650 Lithium
Batteries
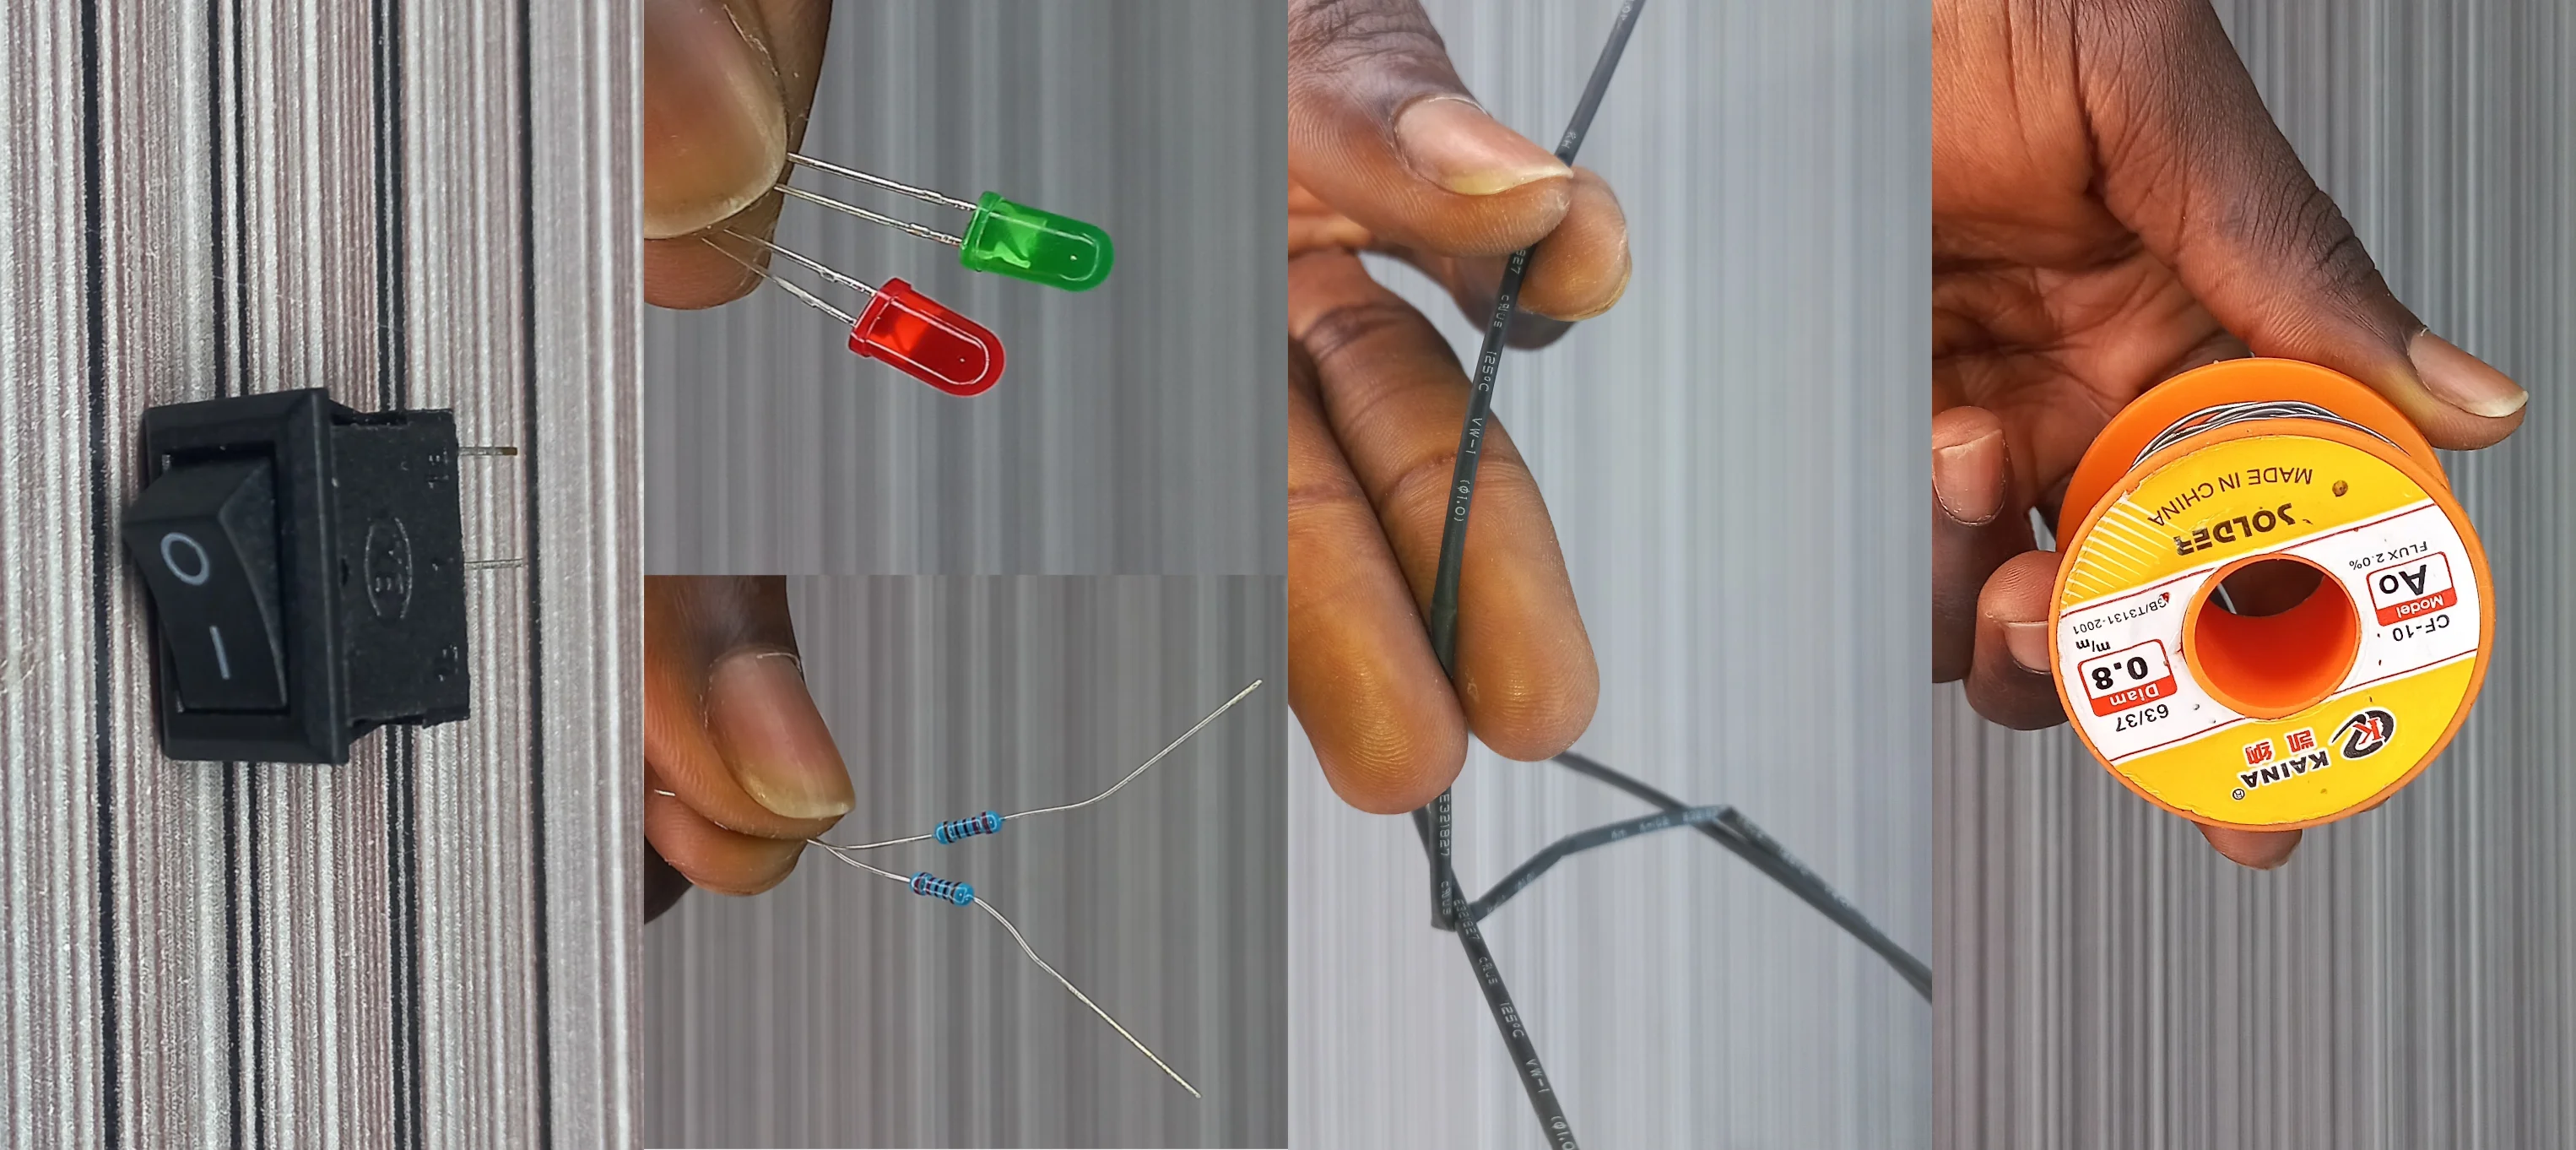
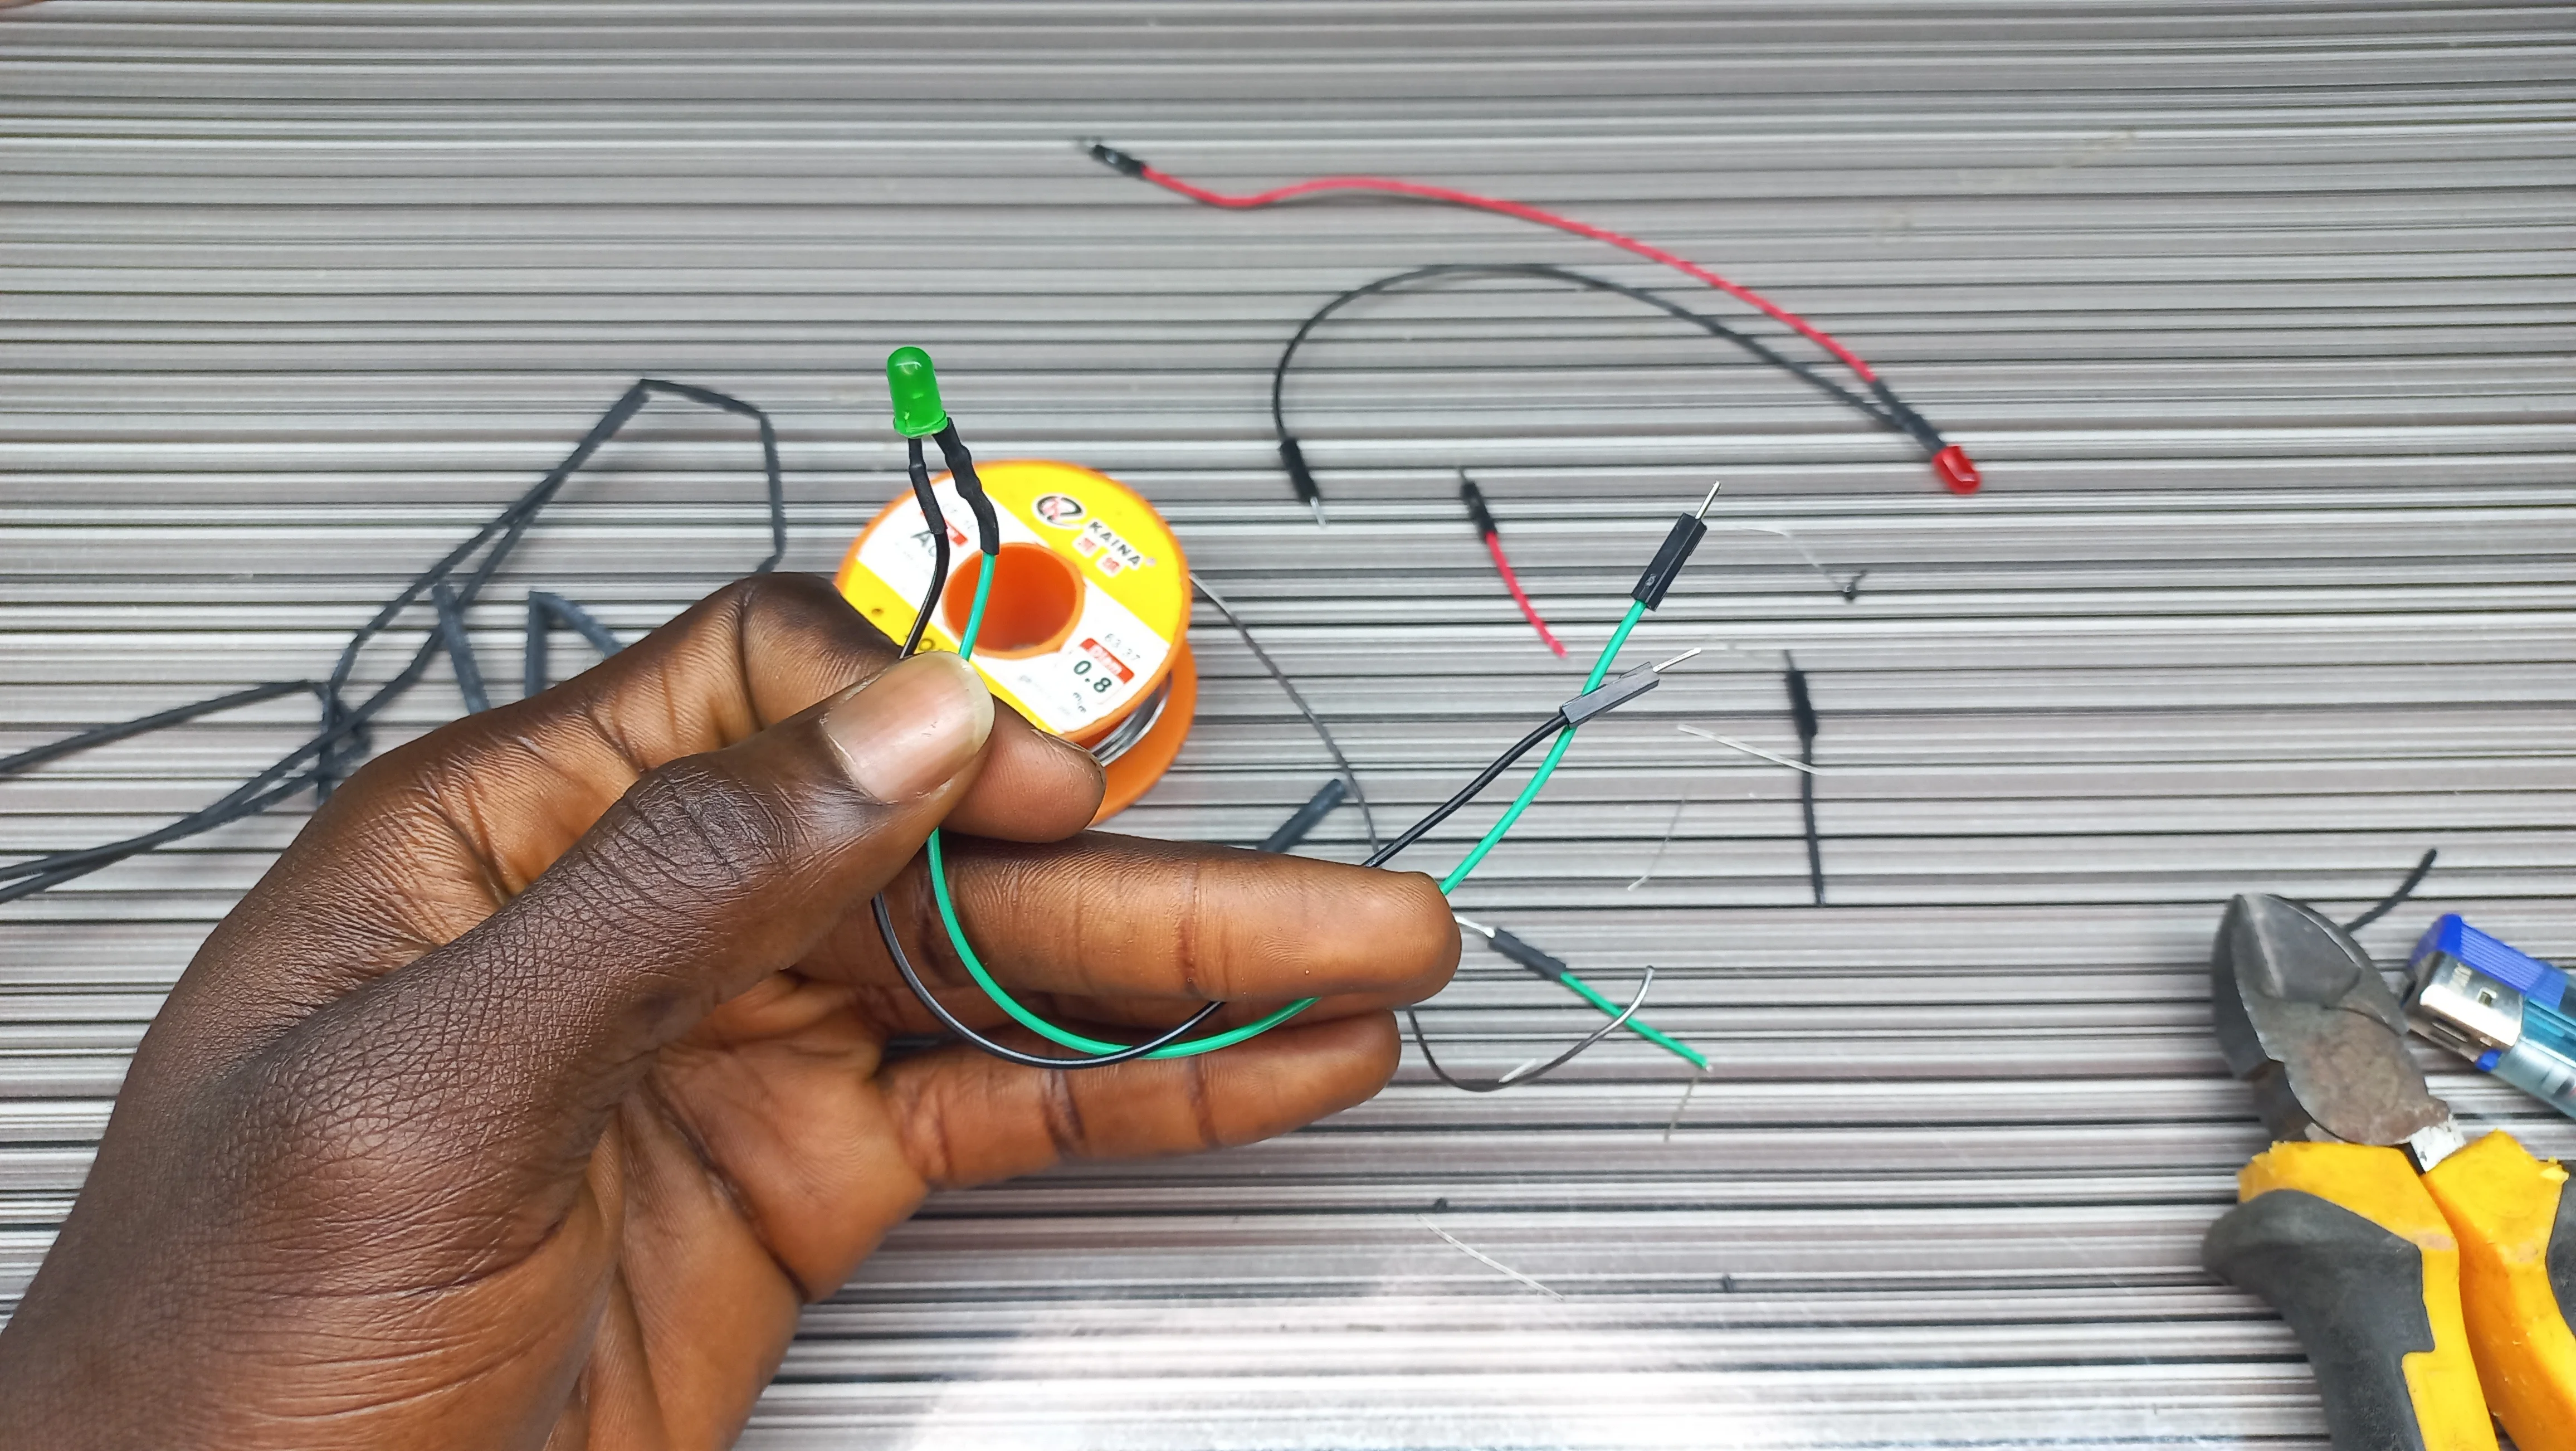
 Switch, LEDs and 220ohm Resistor, Heat Shrink, and Soldering Lead
 LED Soldered
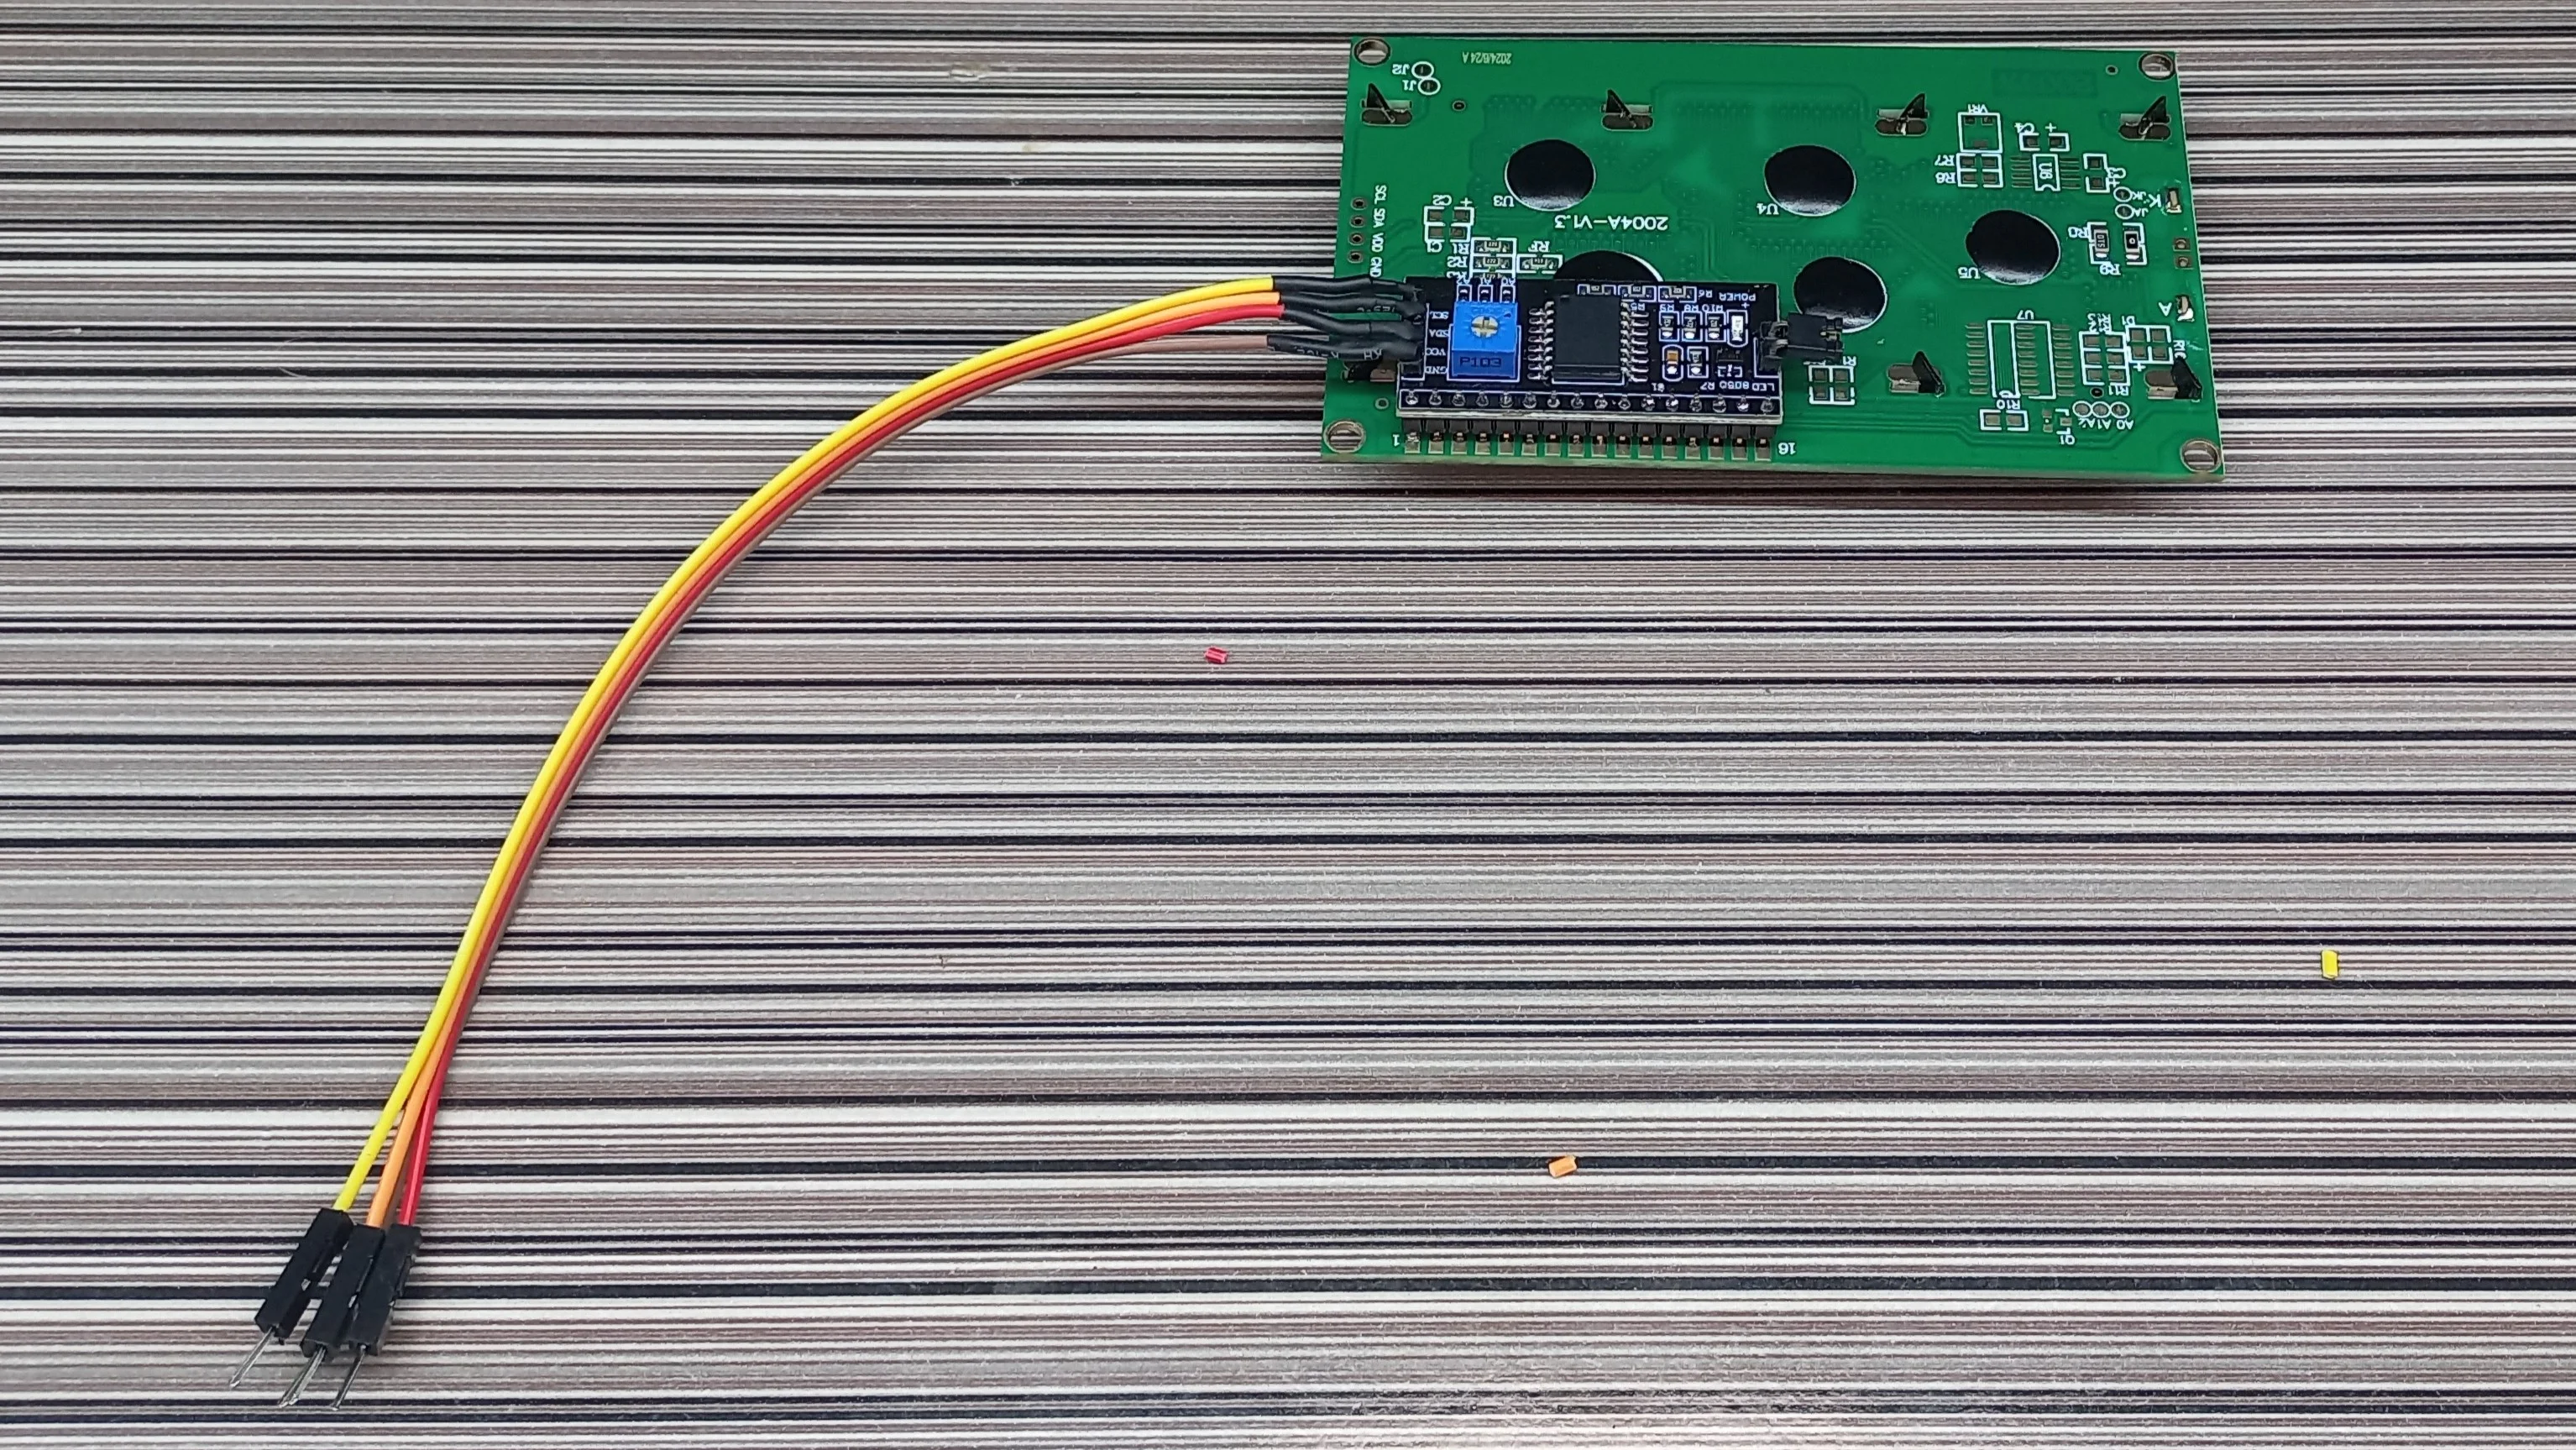
 LCD Soldered
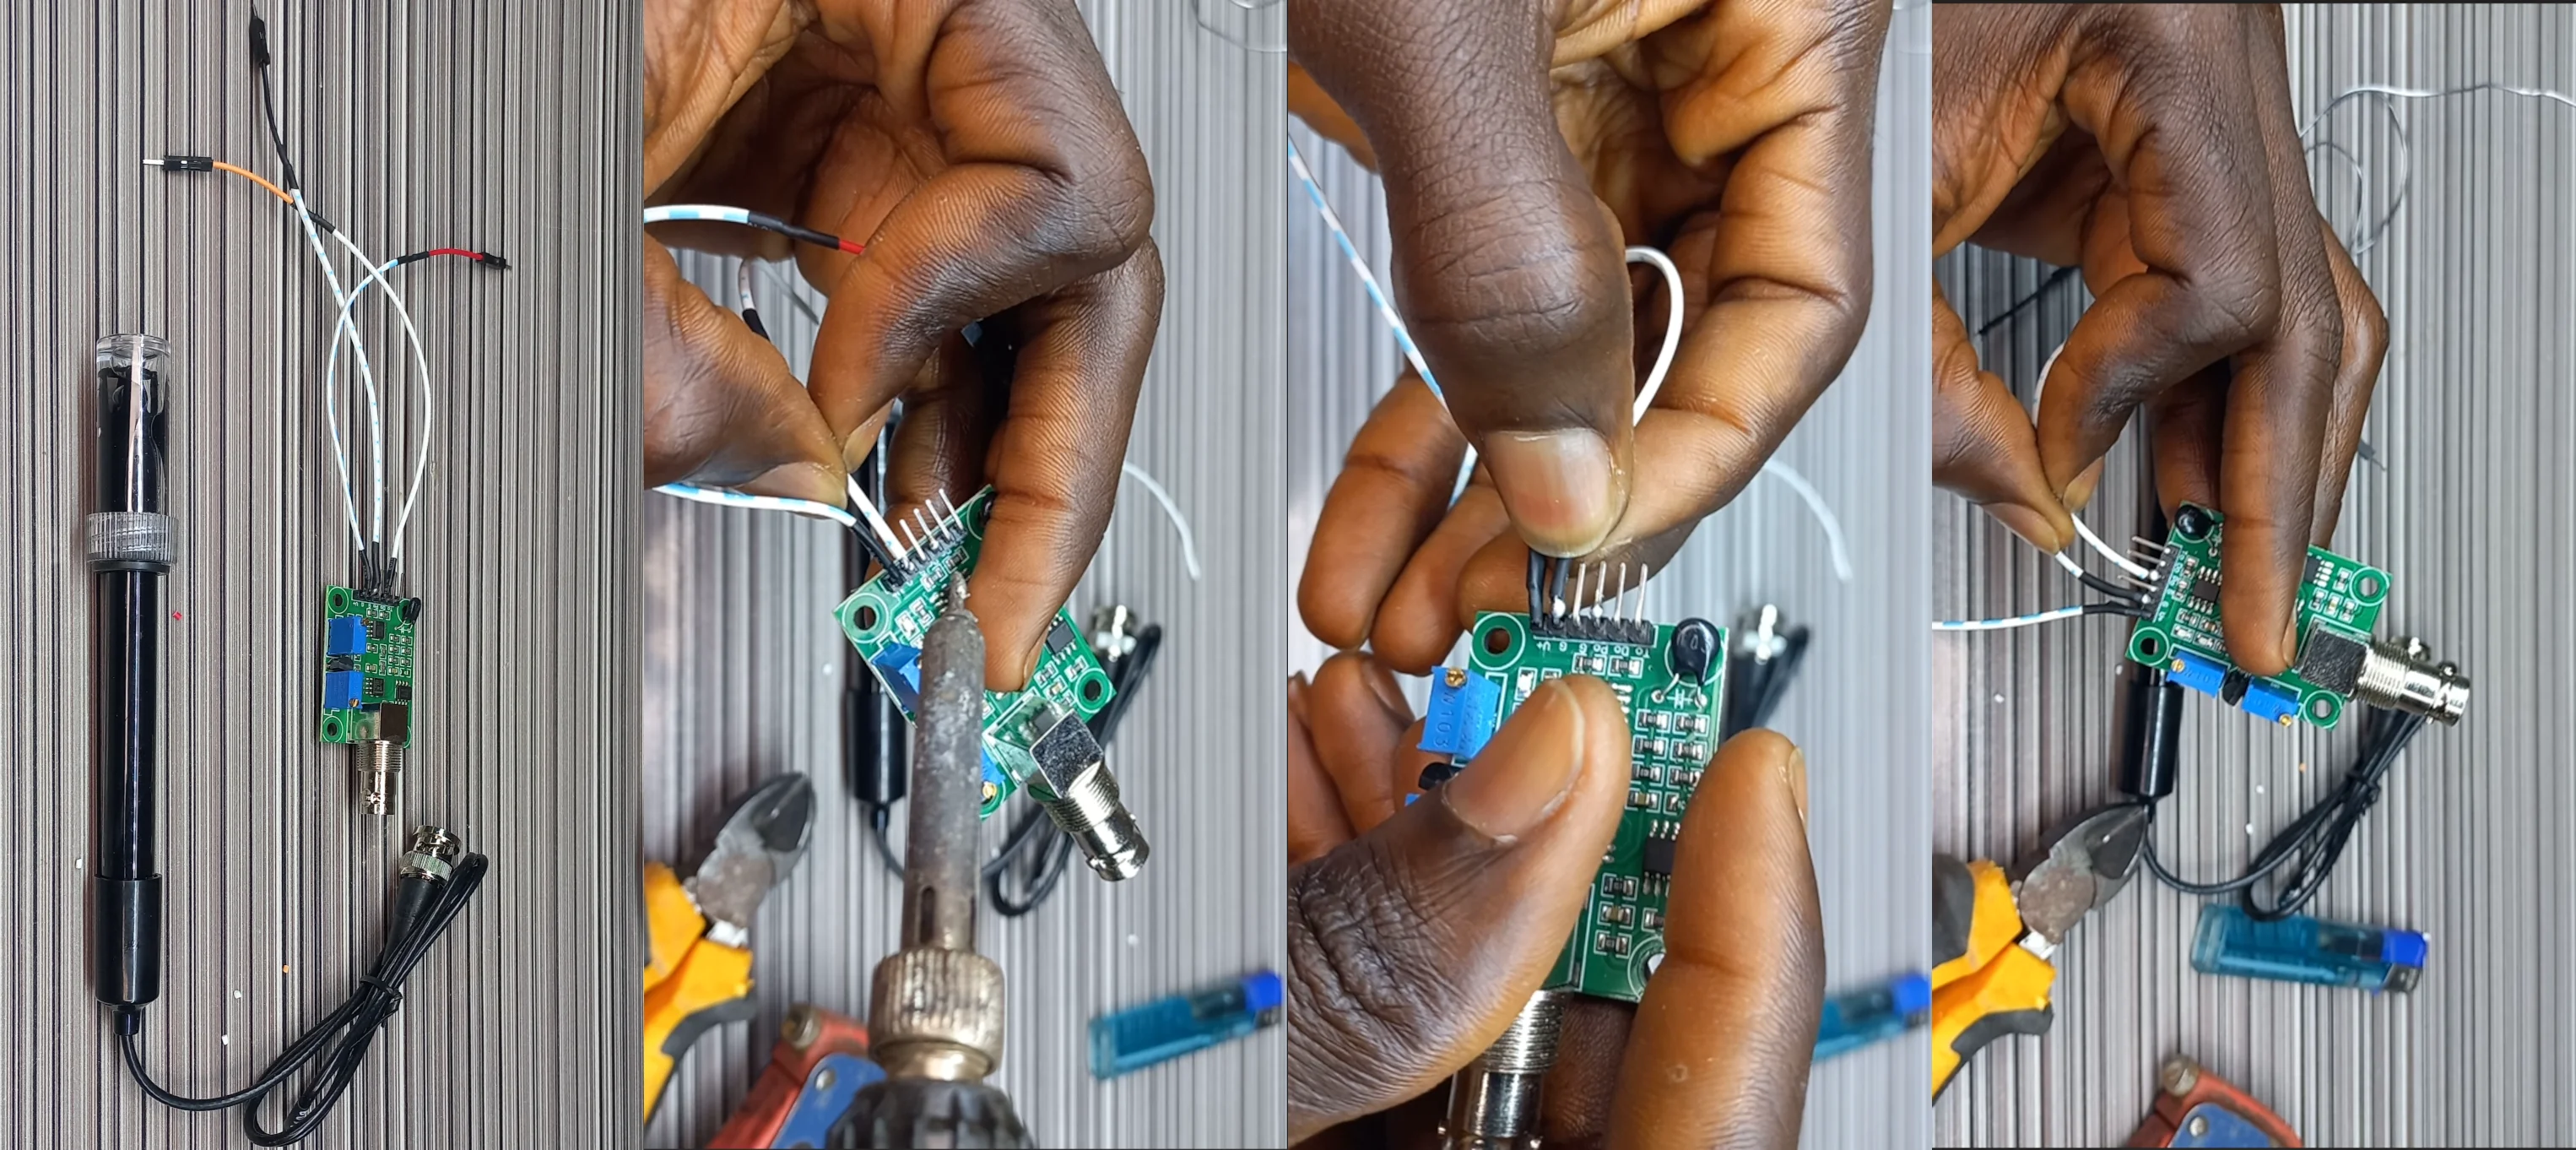
 pH Sensor Soldering
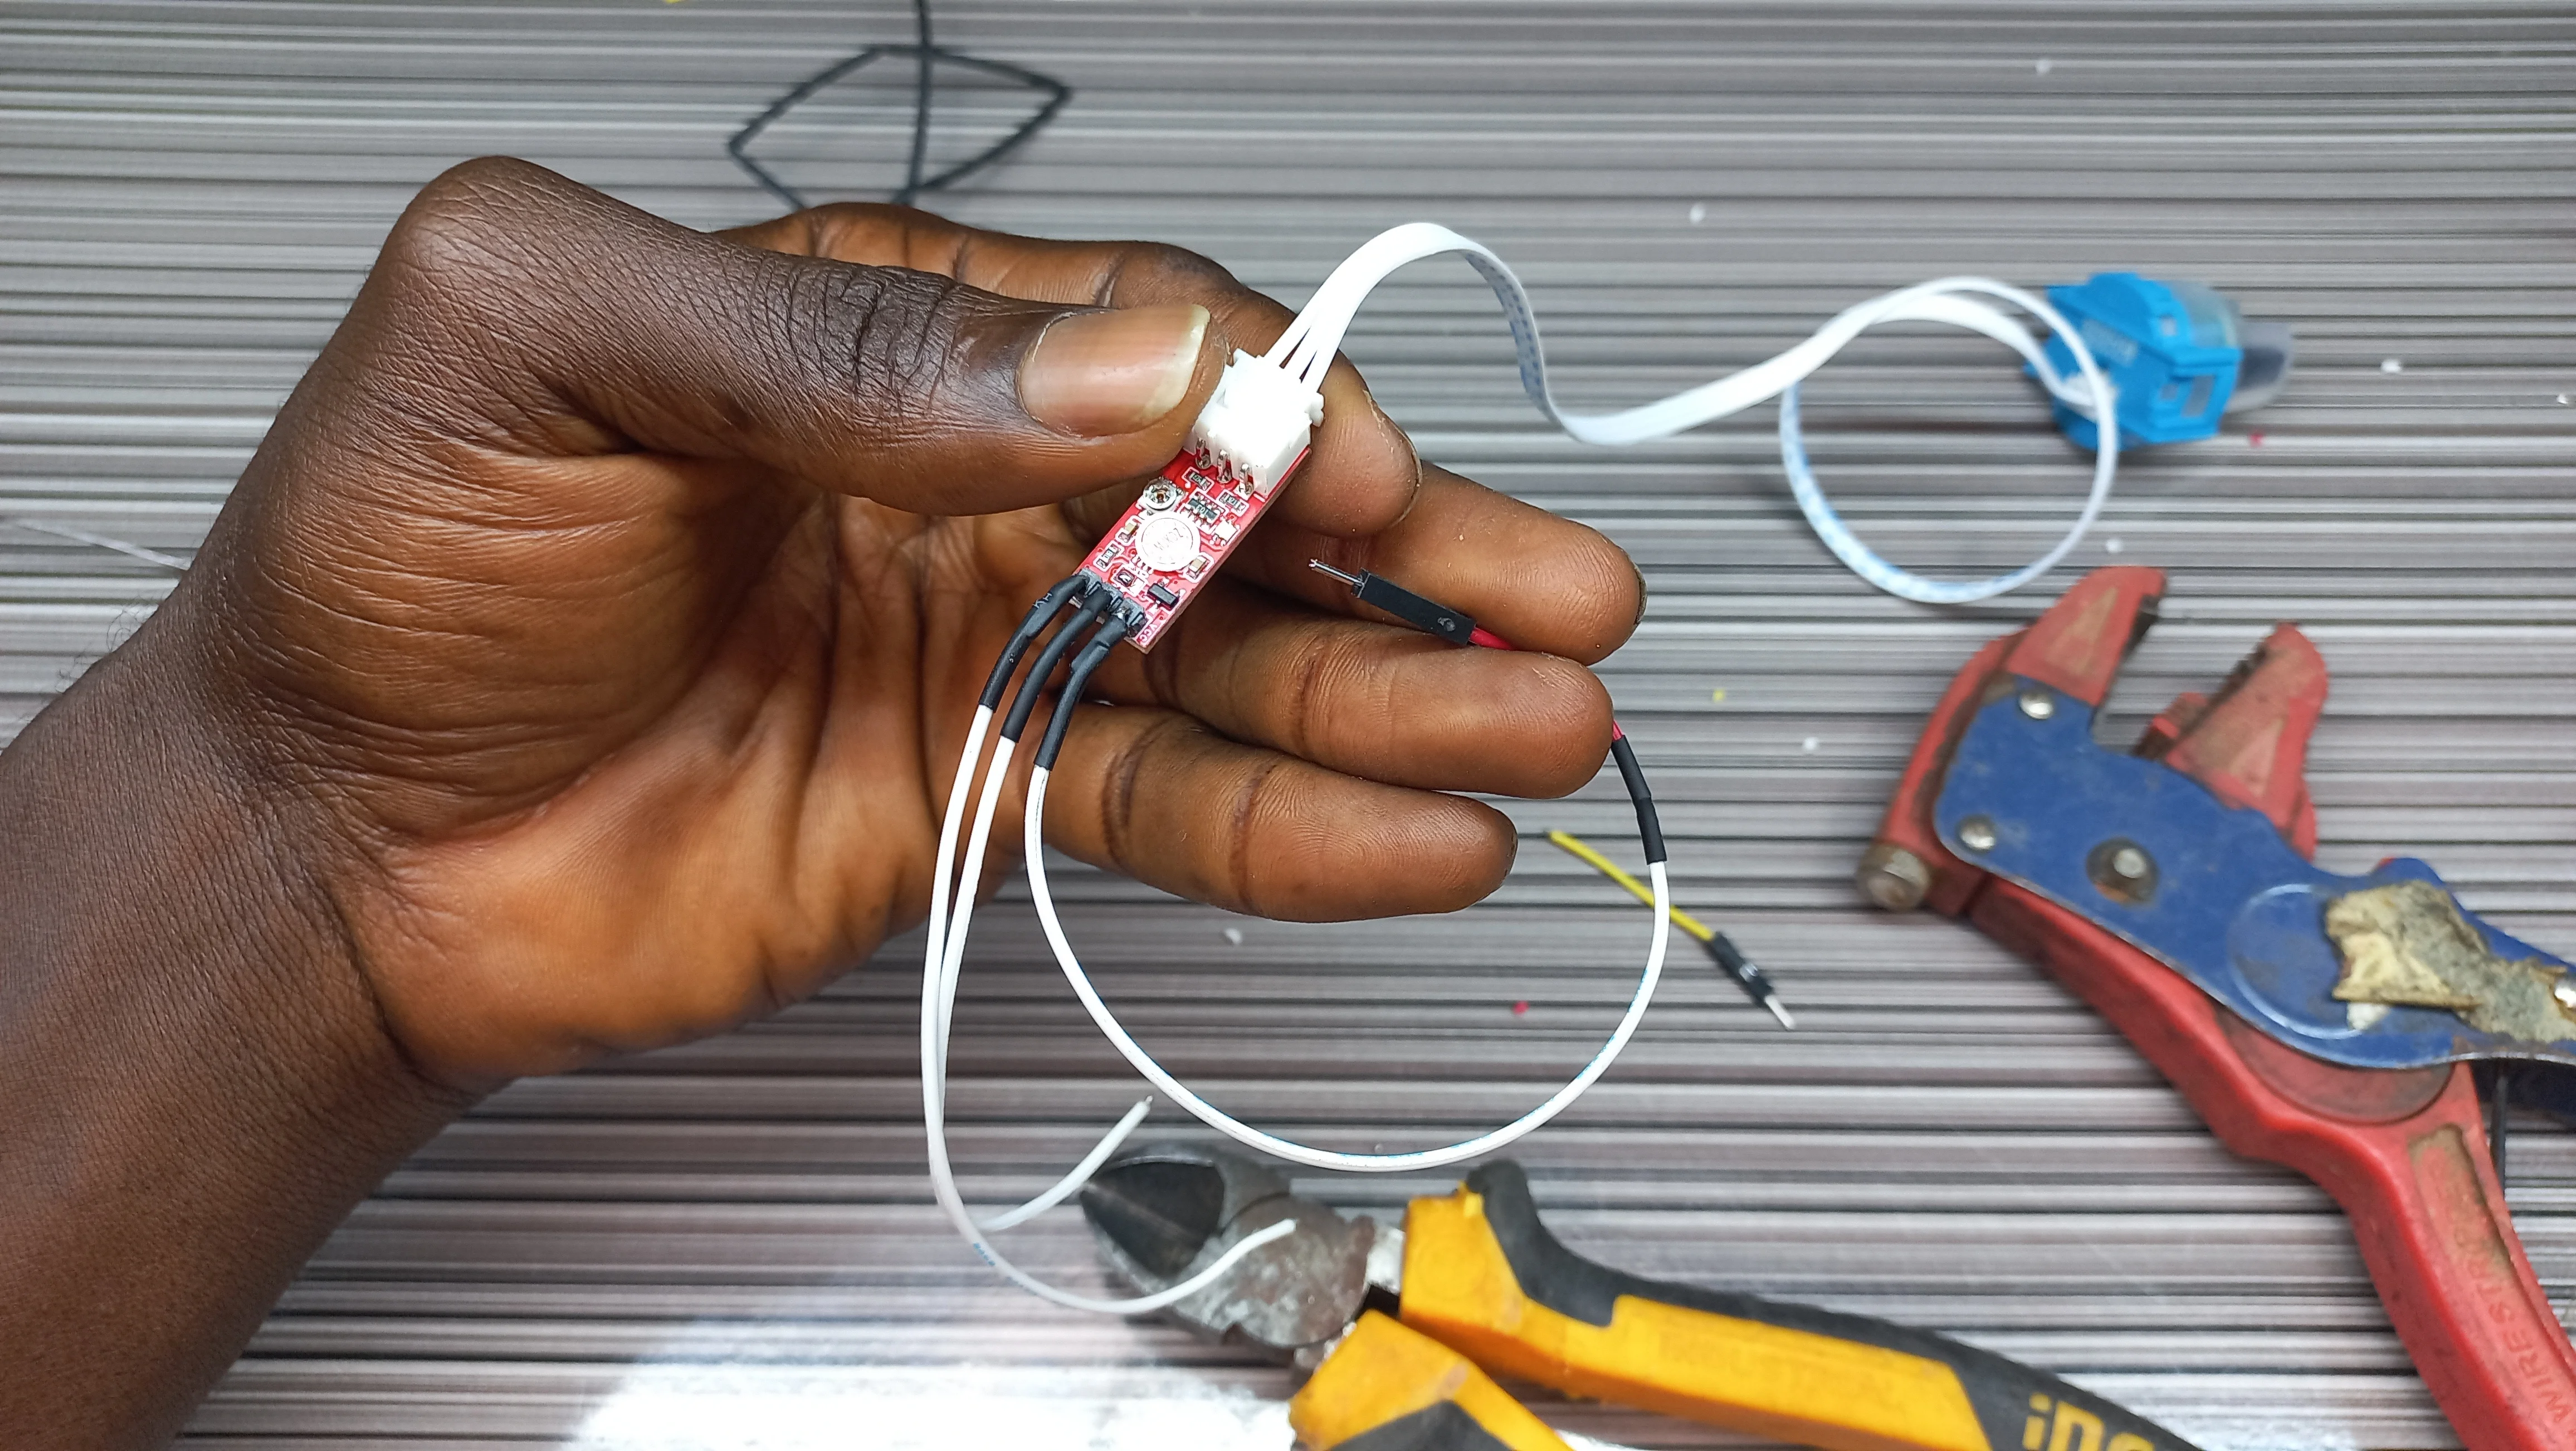
 Connected the Turbidity Sensor Cables
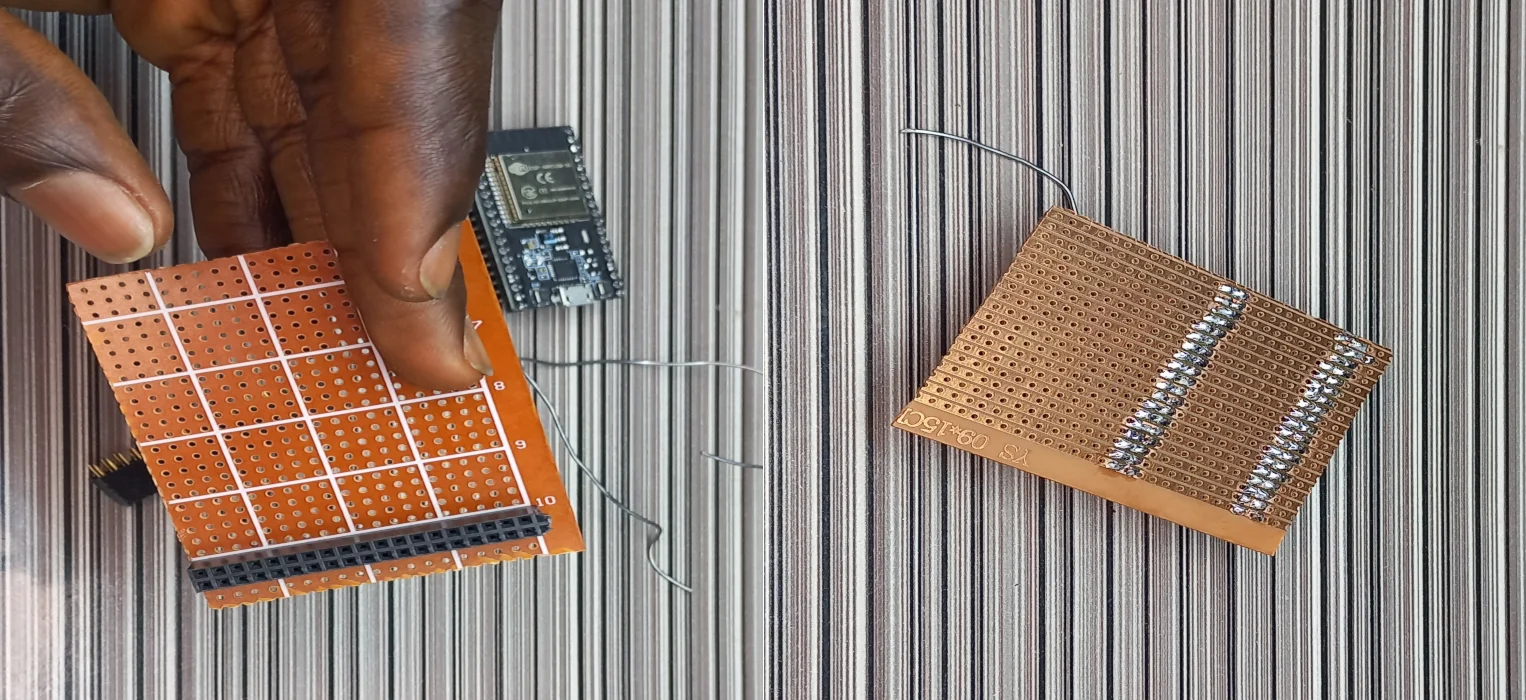
 Connected DIL to Veroboard
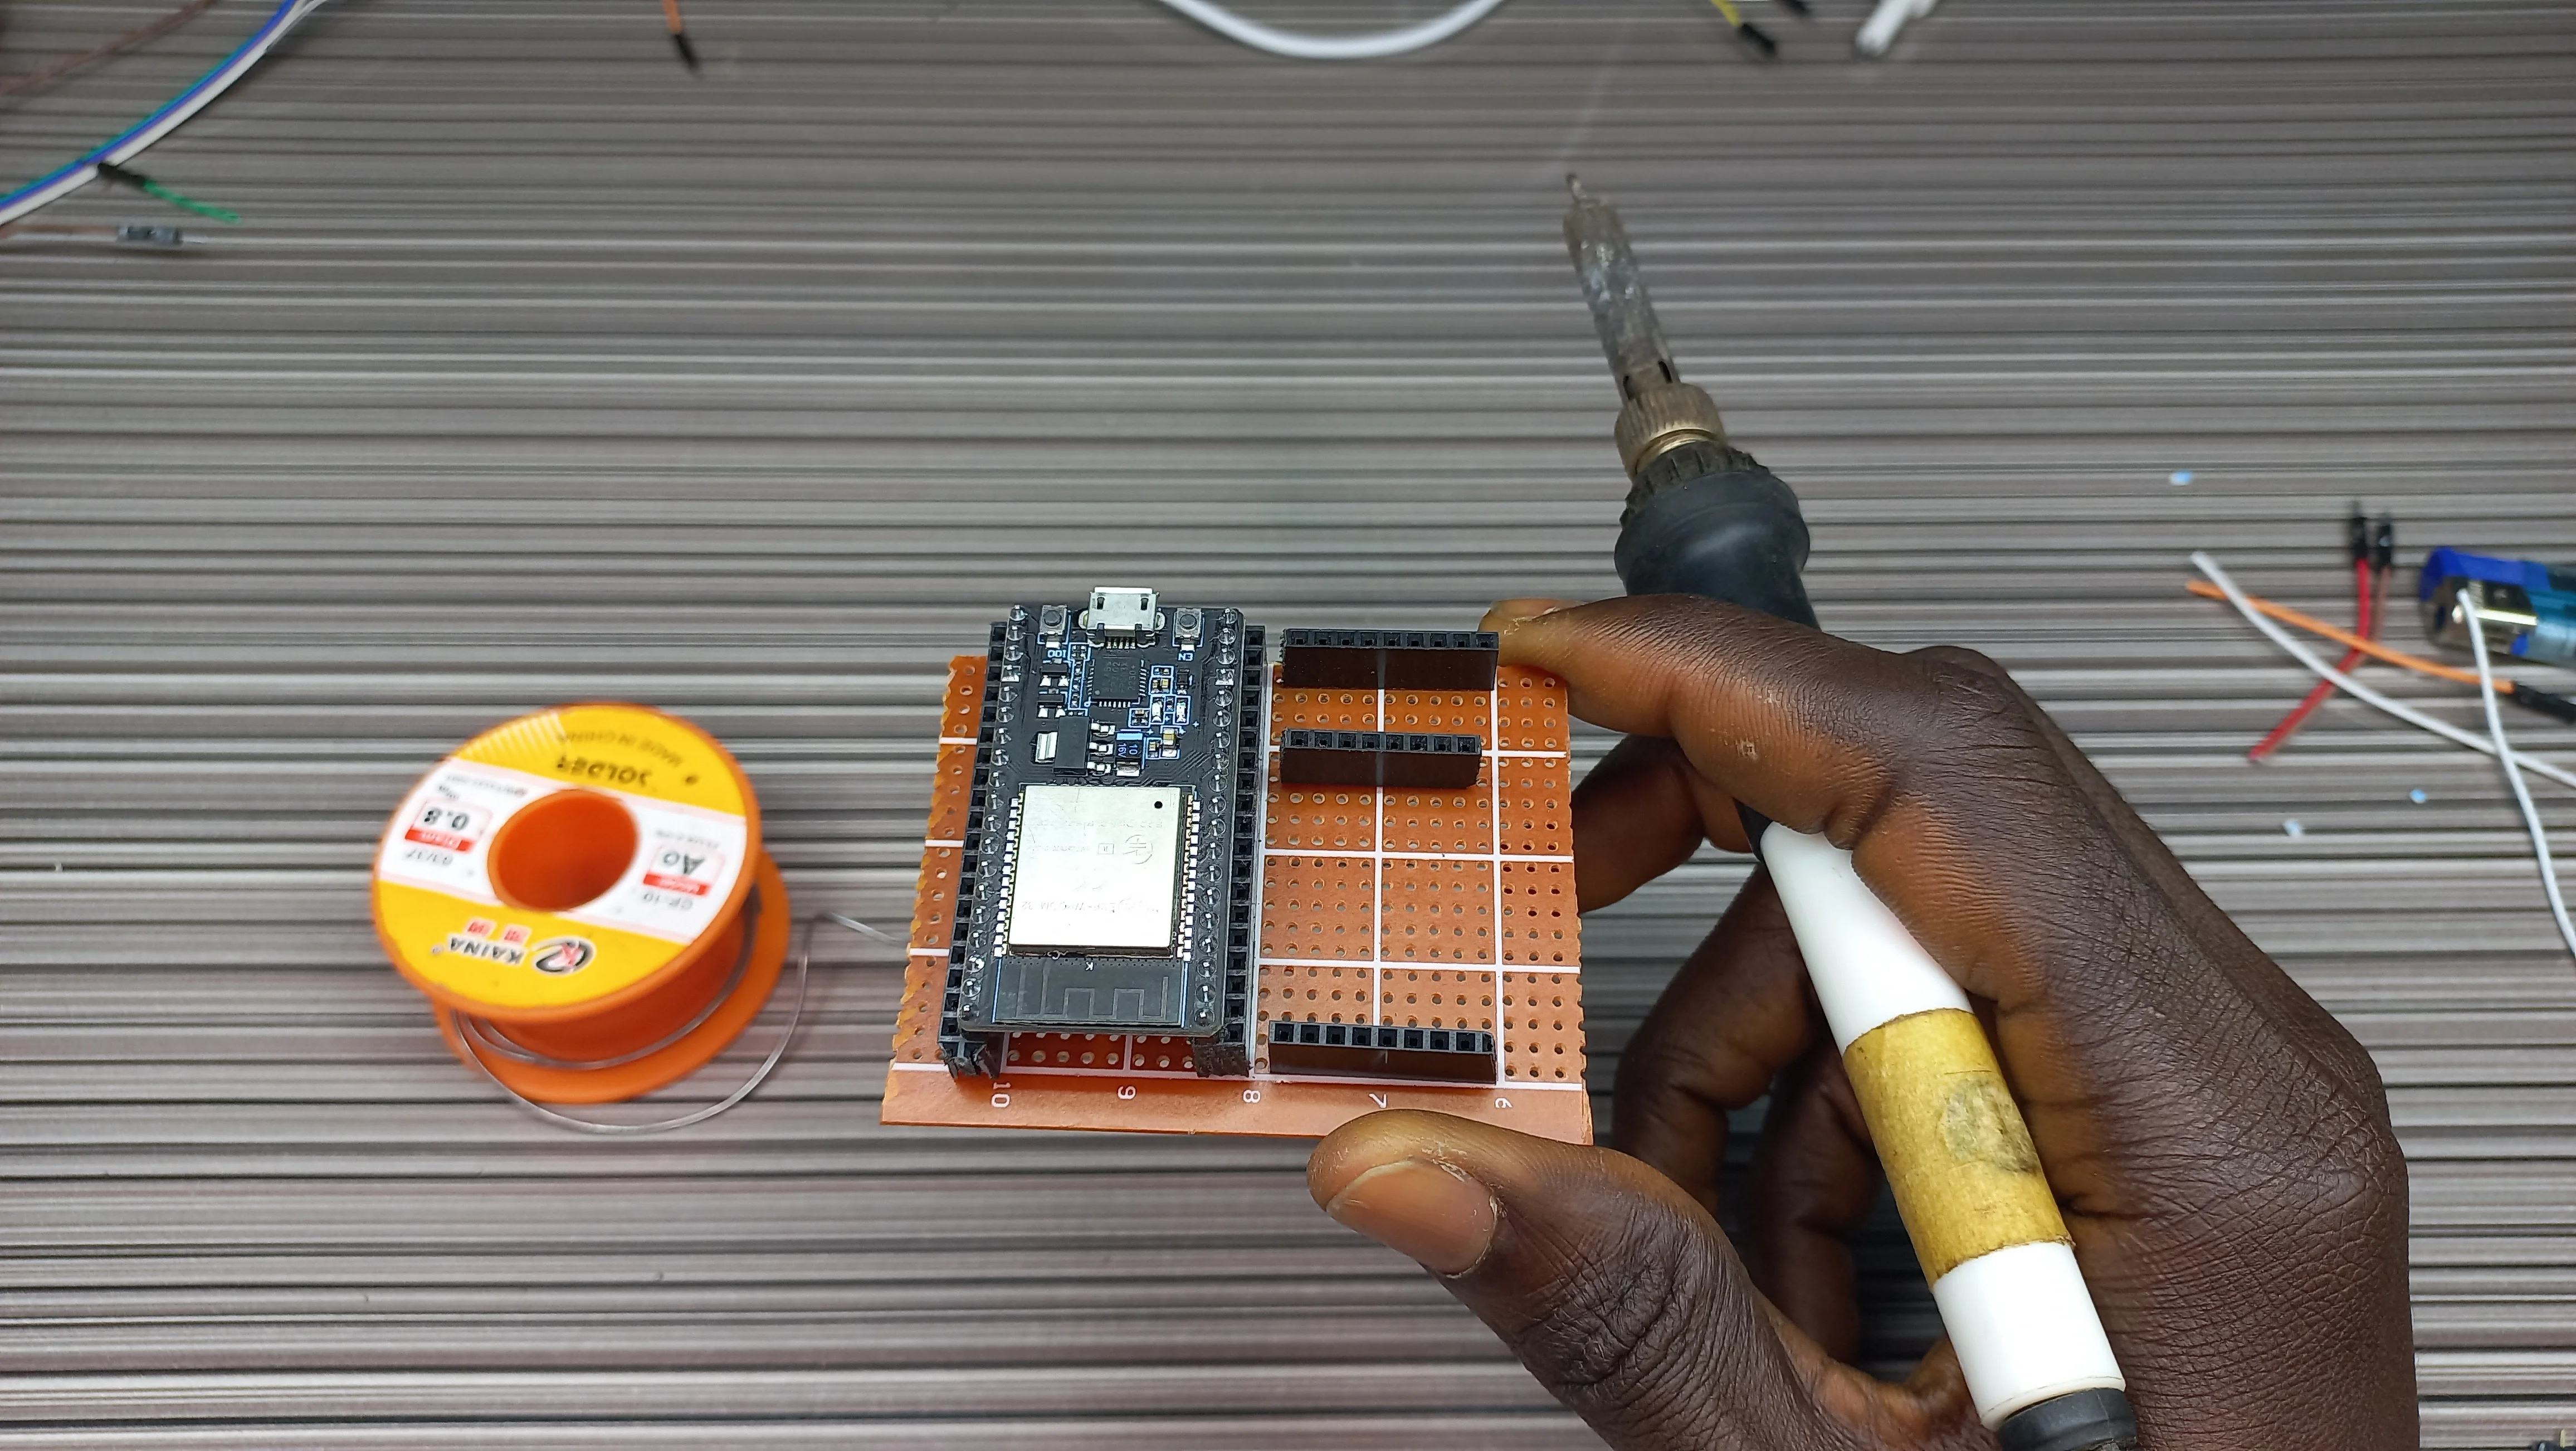
 ESP32 Mounted on the DIL that was connected on the veroboard
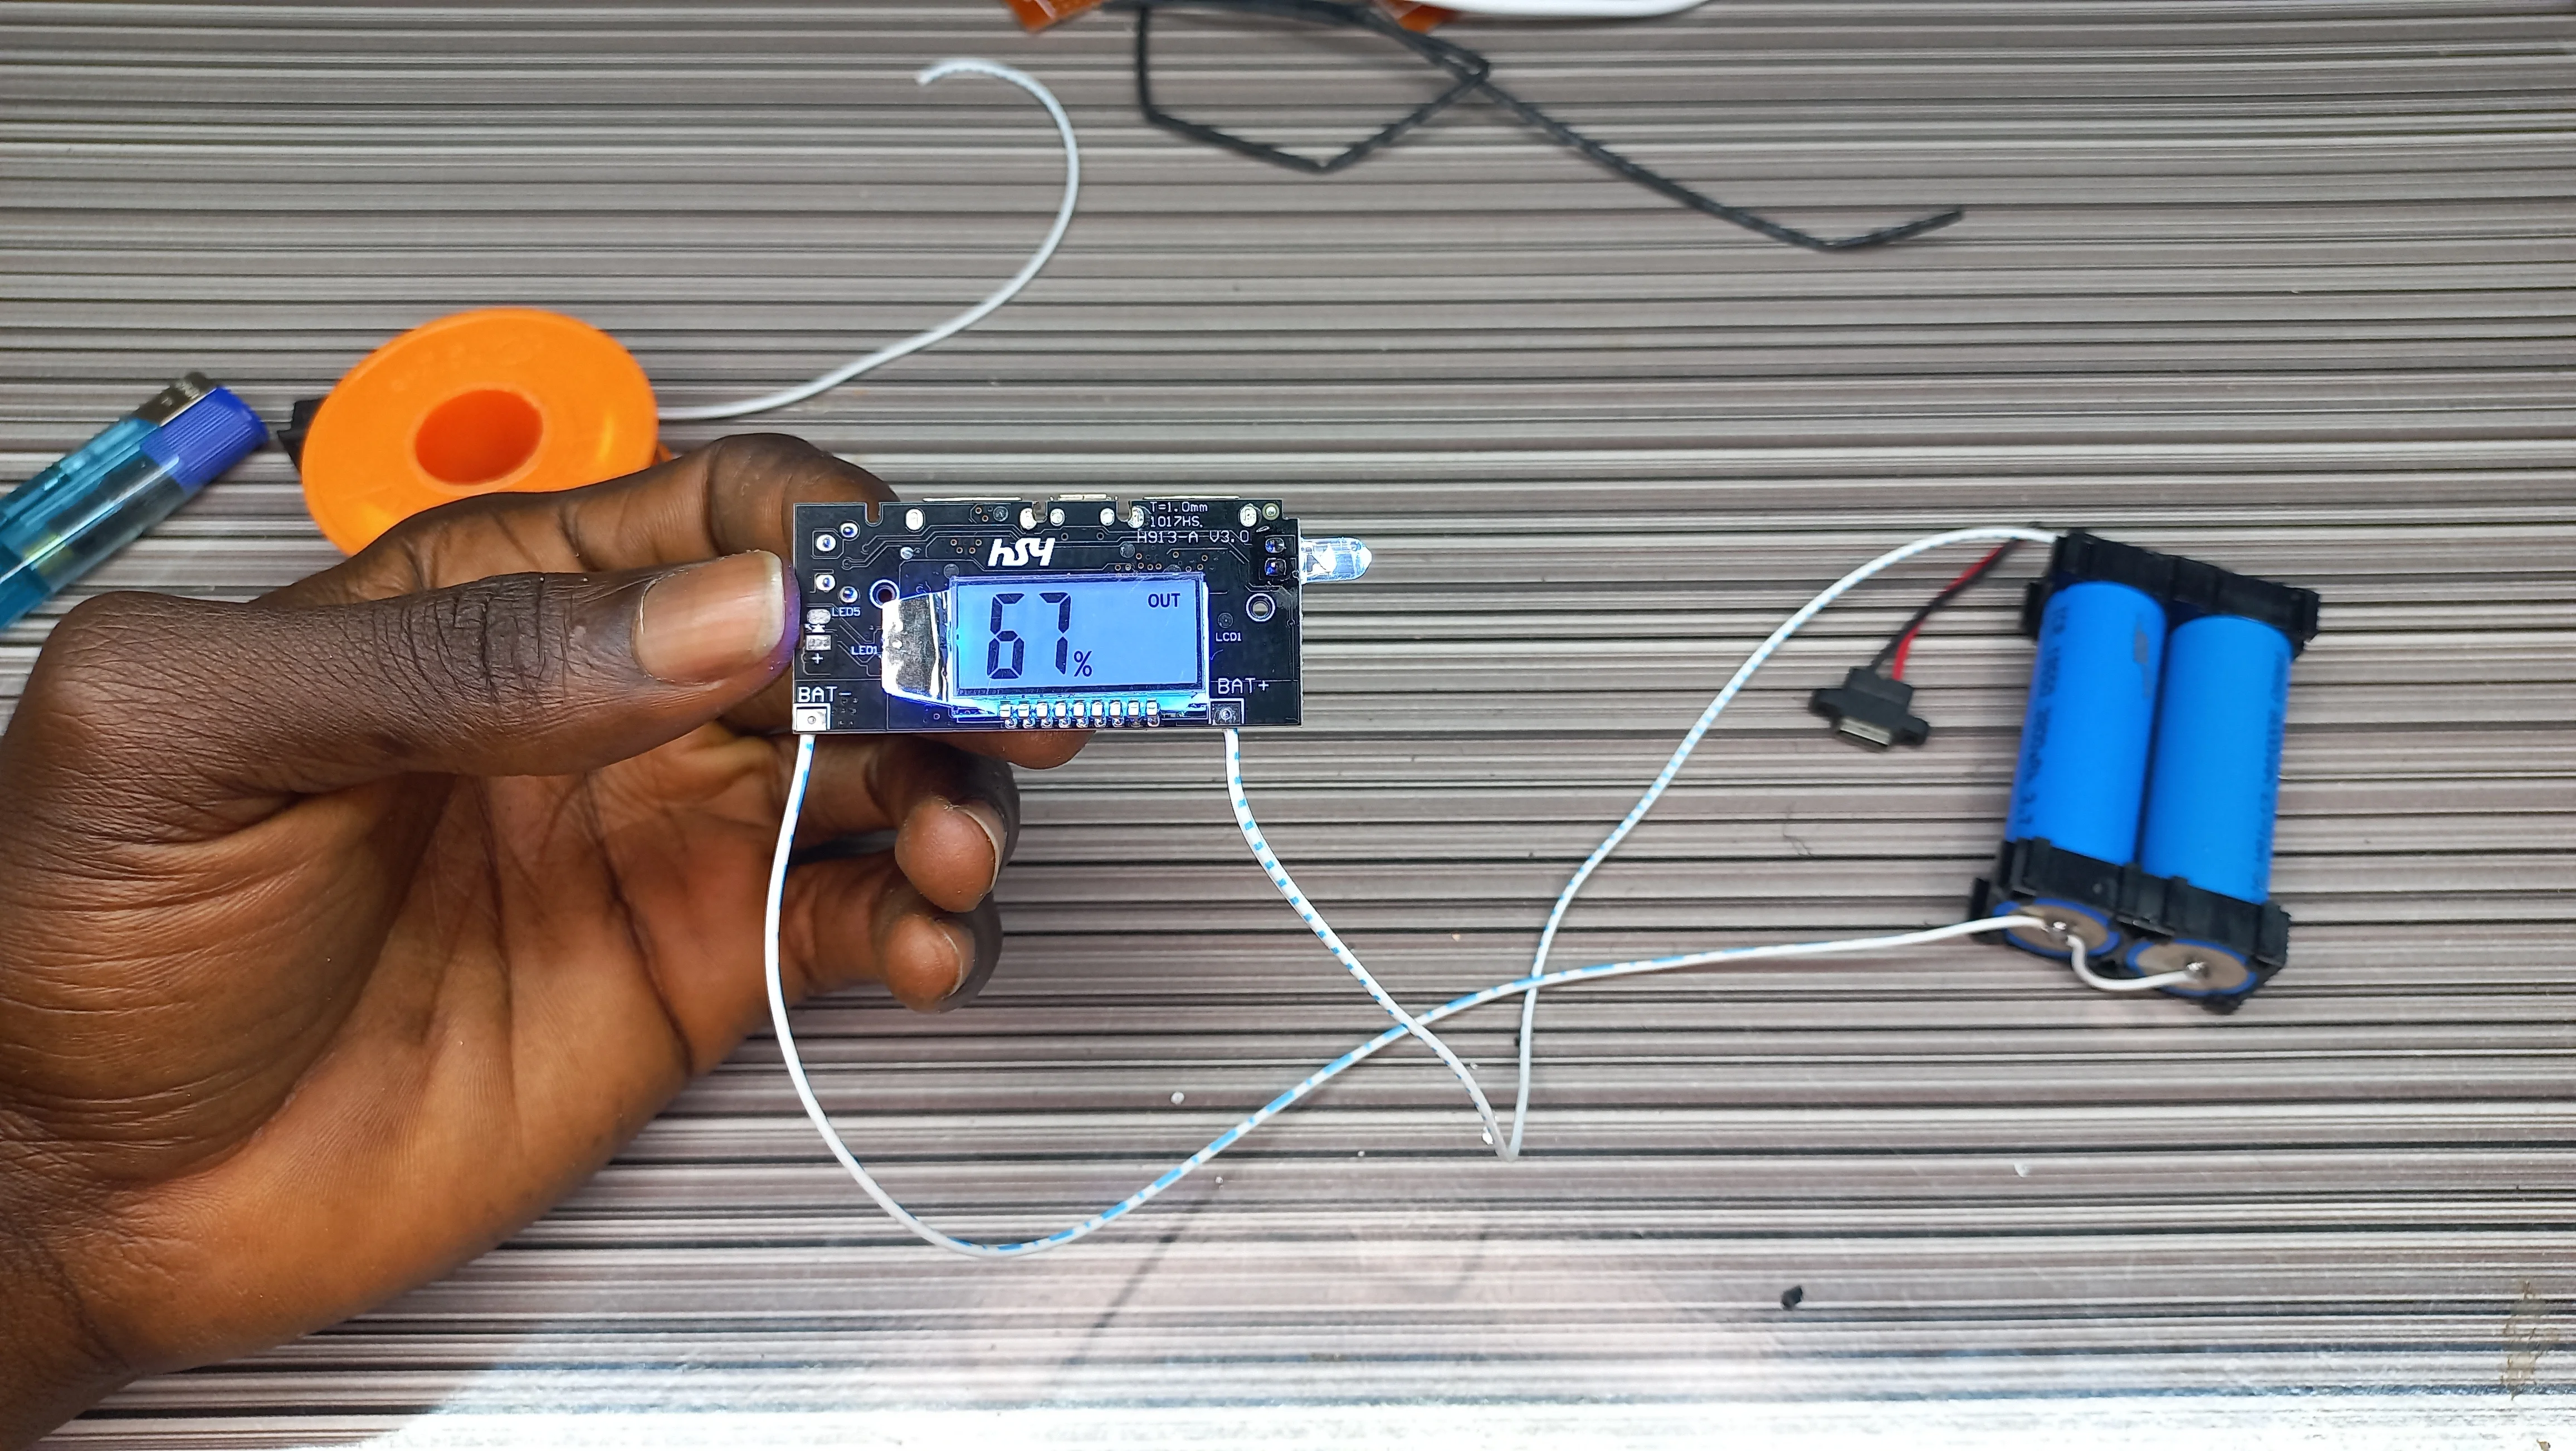
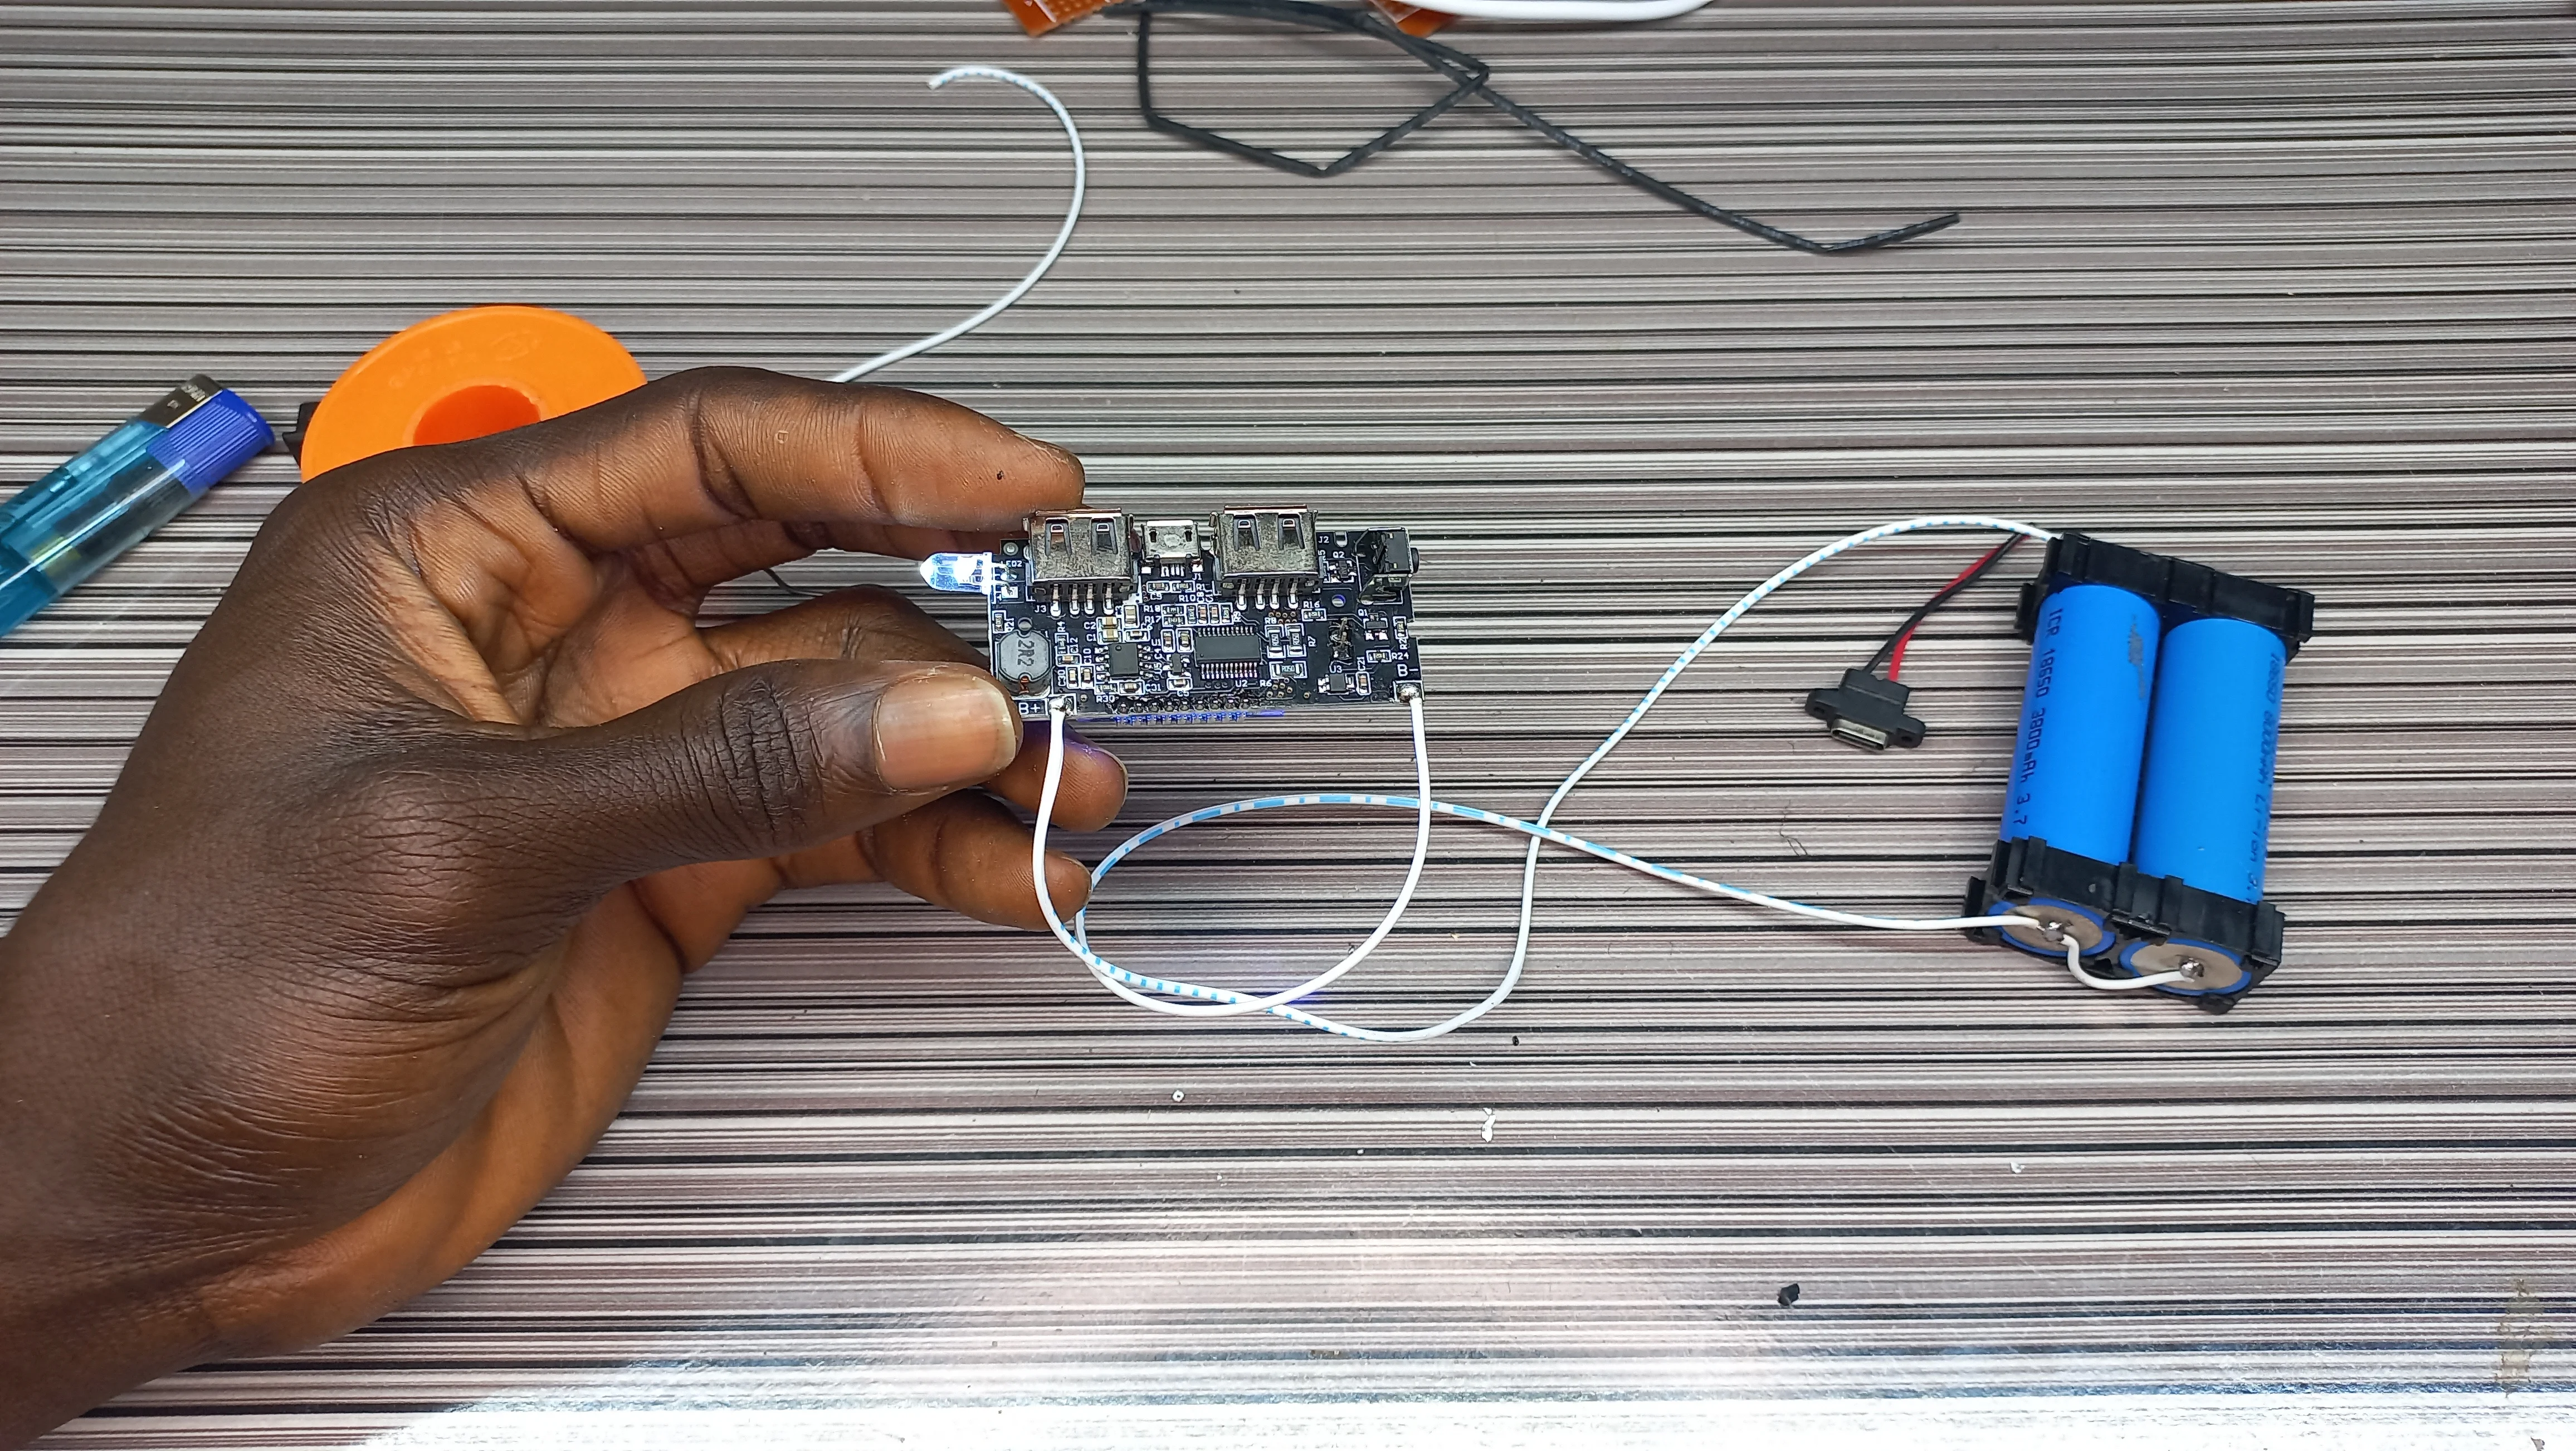
 Charging Module with Battery Test
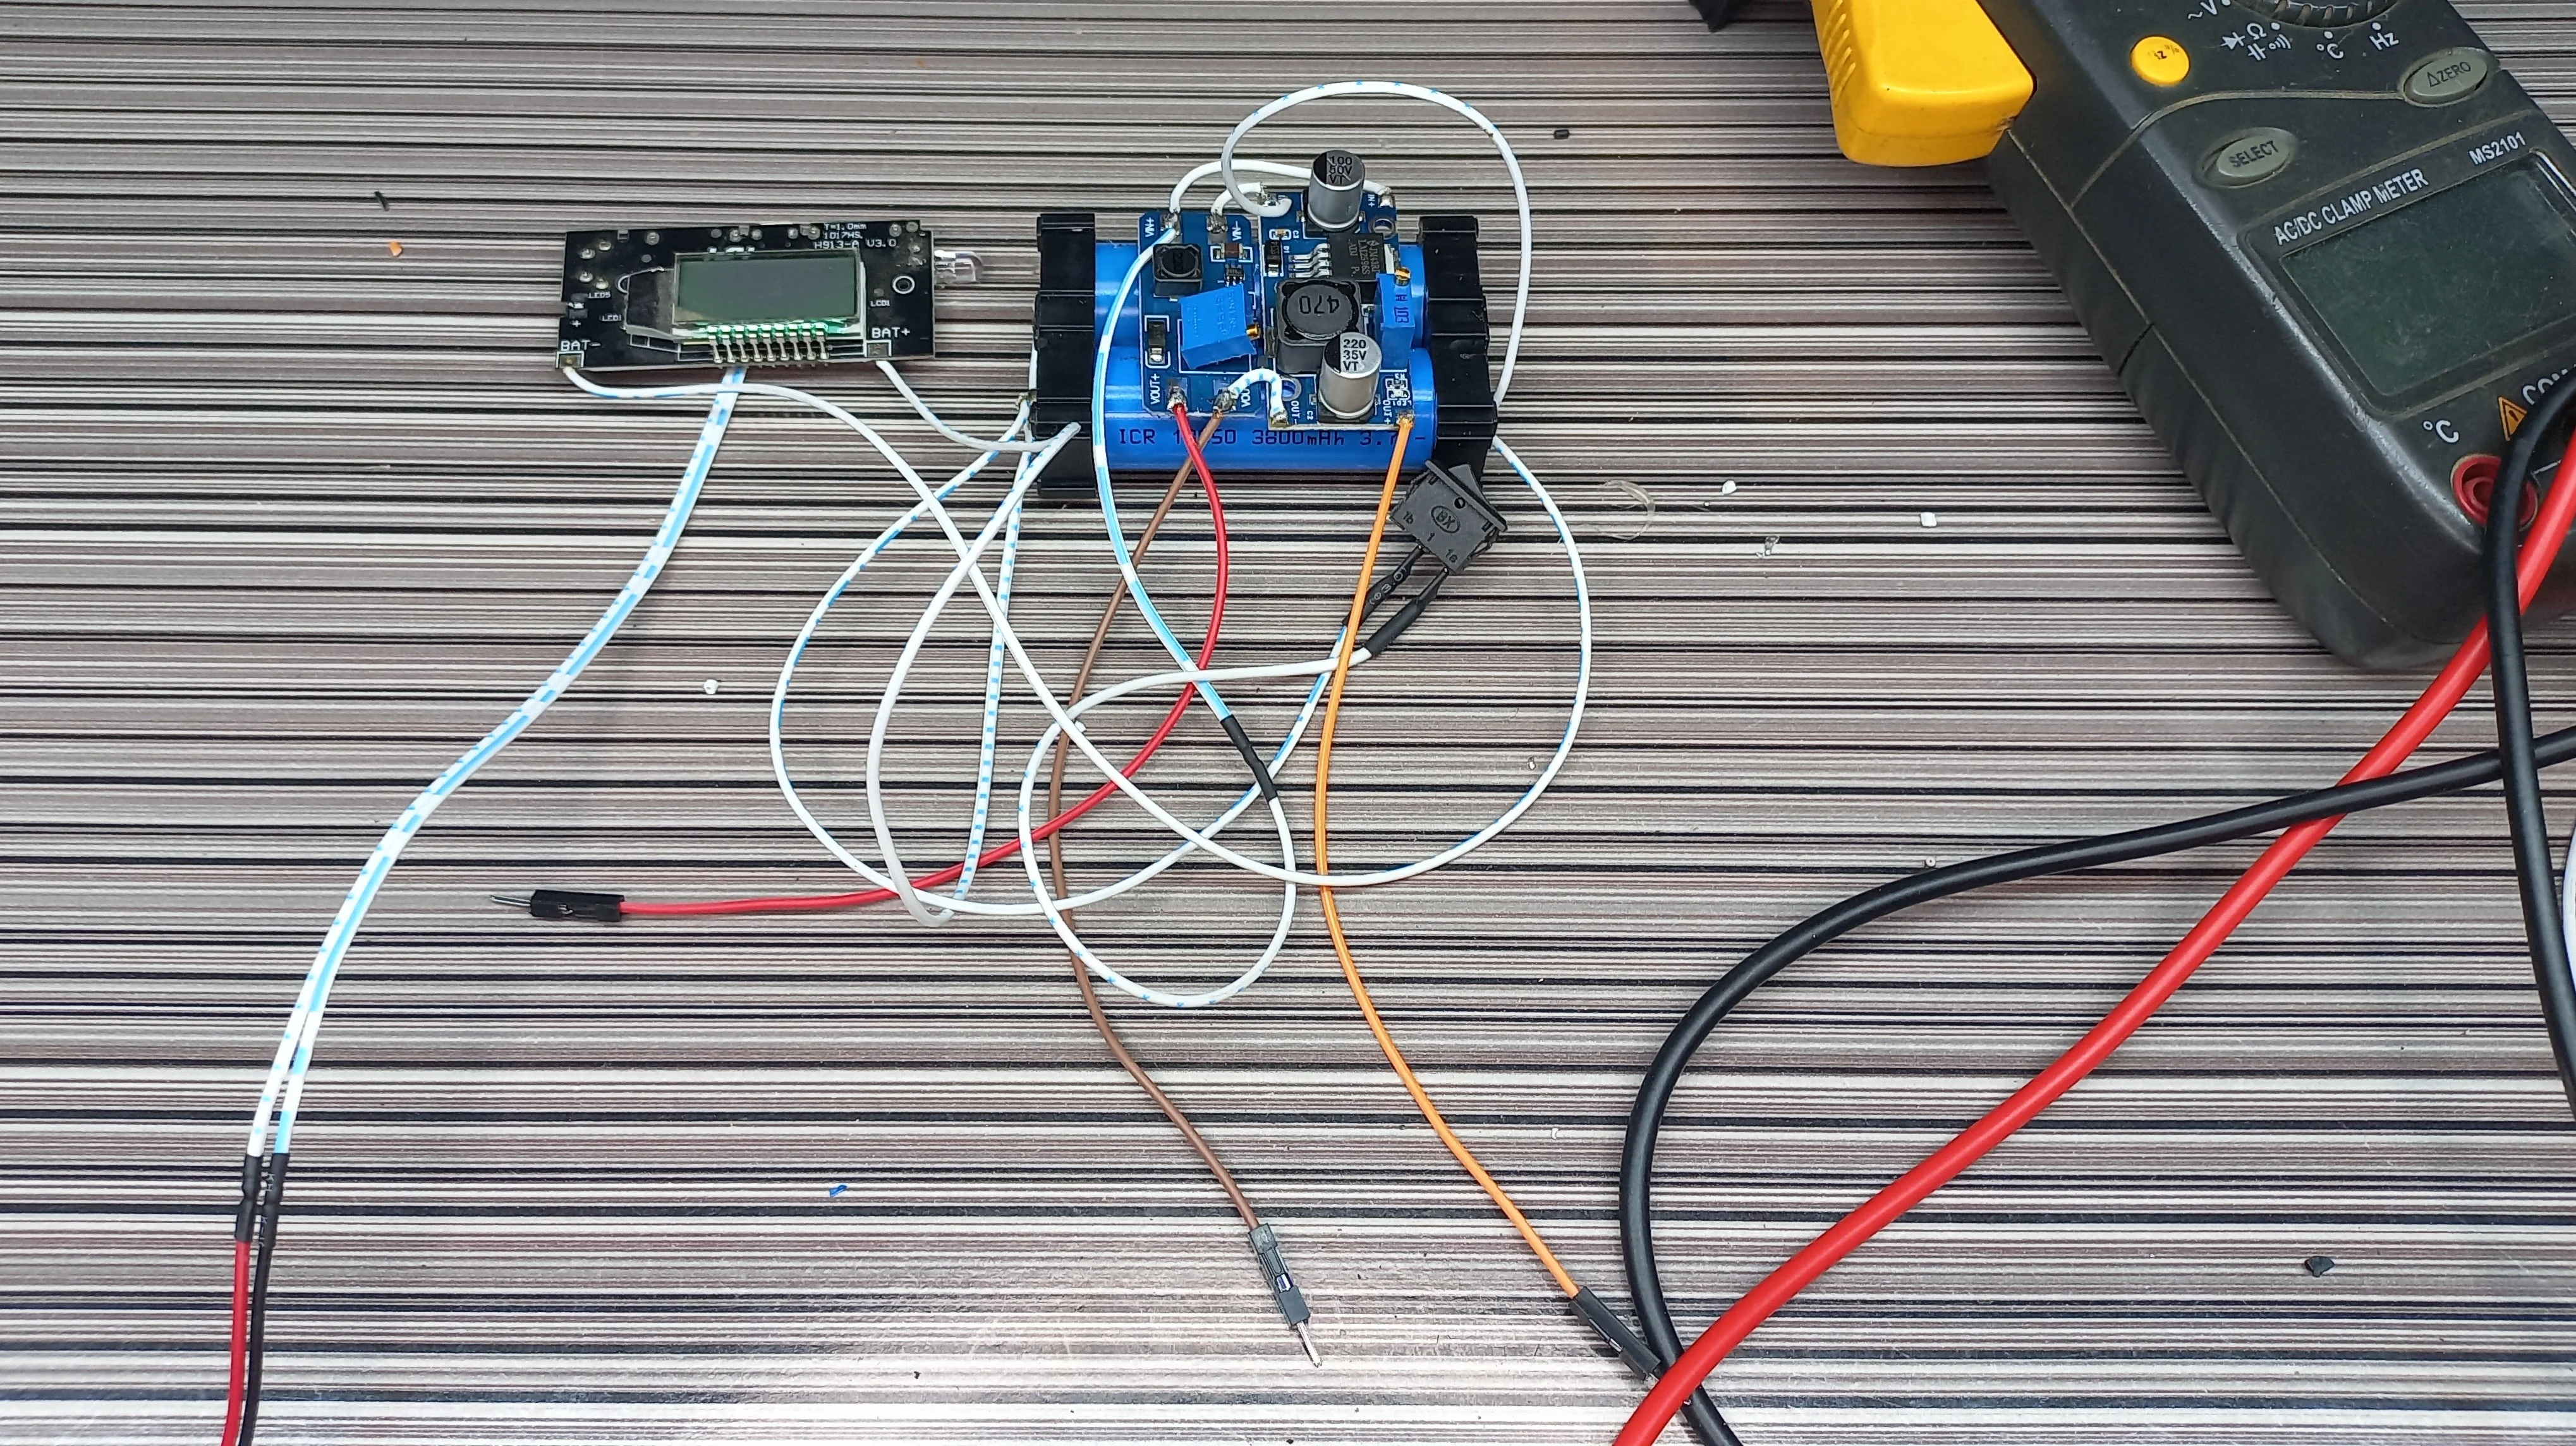
 Power Supply Section
 Everything Altogether Without Casing
Software Implementation
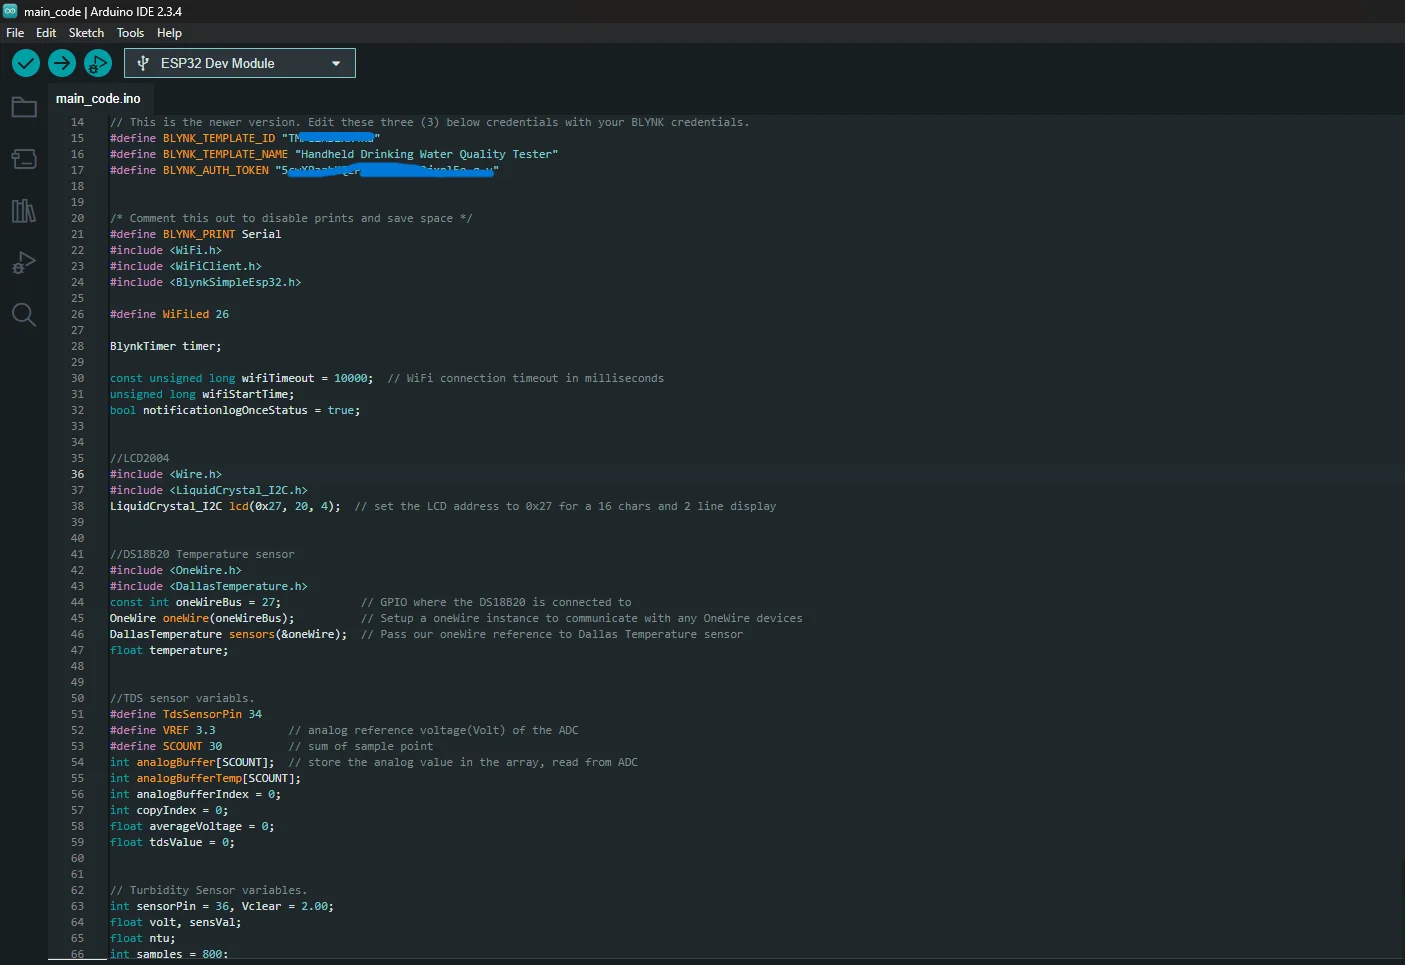
- Programmed using Arduino IDE with C/C++.
- Implemented IoT connectivity via BLYNK for real-time monitoring.
- Developed algorithms to process sensor data and display results on the LCD, mobile and web app.
Challenges & Solutions
- Challenge: Ensuring sensor accuracy under varying conditions.
Solution: Calibrated sensors using standard solutions and tested in controlled environments. - Challenge: Power management for extended operation.
Solution: Used high-capacity lithium-ion batteries with efficient voltage regulators. - Challenge: Simplifying user interaction.
Solution: Developed intuitive interfaces with LCD and mobile app support.
Results & Impact
- Comprehensive Monitoring: Successfully measured critical water quality parameters, including pH, turbidity, temperature, and TDS, with high accuracy. Achieved minimal deviation in results (e.g., pH MAE = 0.09, temperature MAE = 0.16°C).
- User-Friendly Design: Achieved a compact and portable device with clear LCD feedback and an intuitive mobile app for real-time data visualization.
- IoT Integration: Seamlessly connected to the BLYNK mobile application, enabling remote monitoring and control of water quality data.
- Field Usability: Validated device performance under diverse environmental conditions, demonstrating reliability and accuracy.
- Energy Efficiency: Optimized power usage to provide an extended runtime of approximately 11.5 hours per full charge.
Final Results
TDS Sensor Gradual Increment by Adding Salt - 0ppm, 77ppm, 176ppm, 188ppm ... until
967ppm
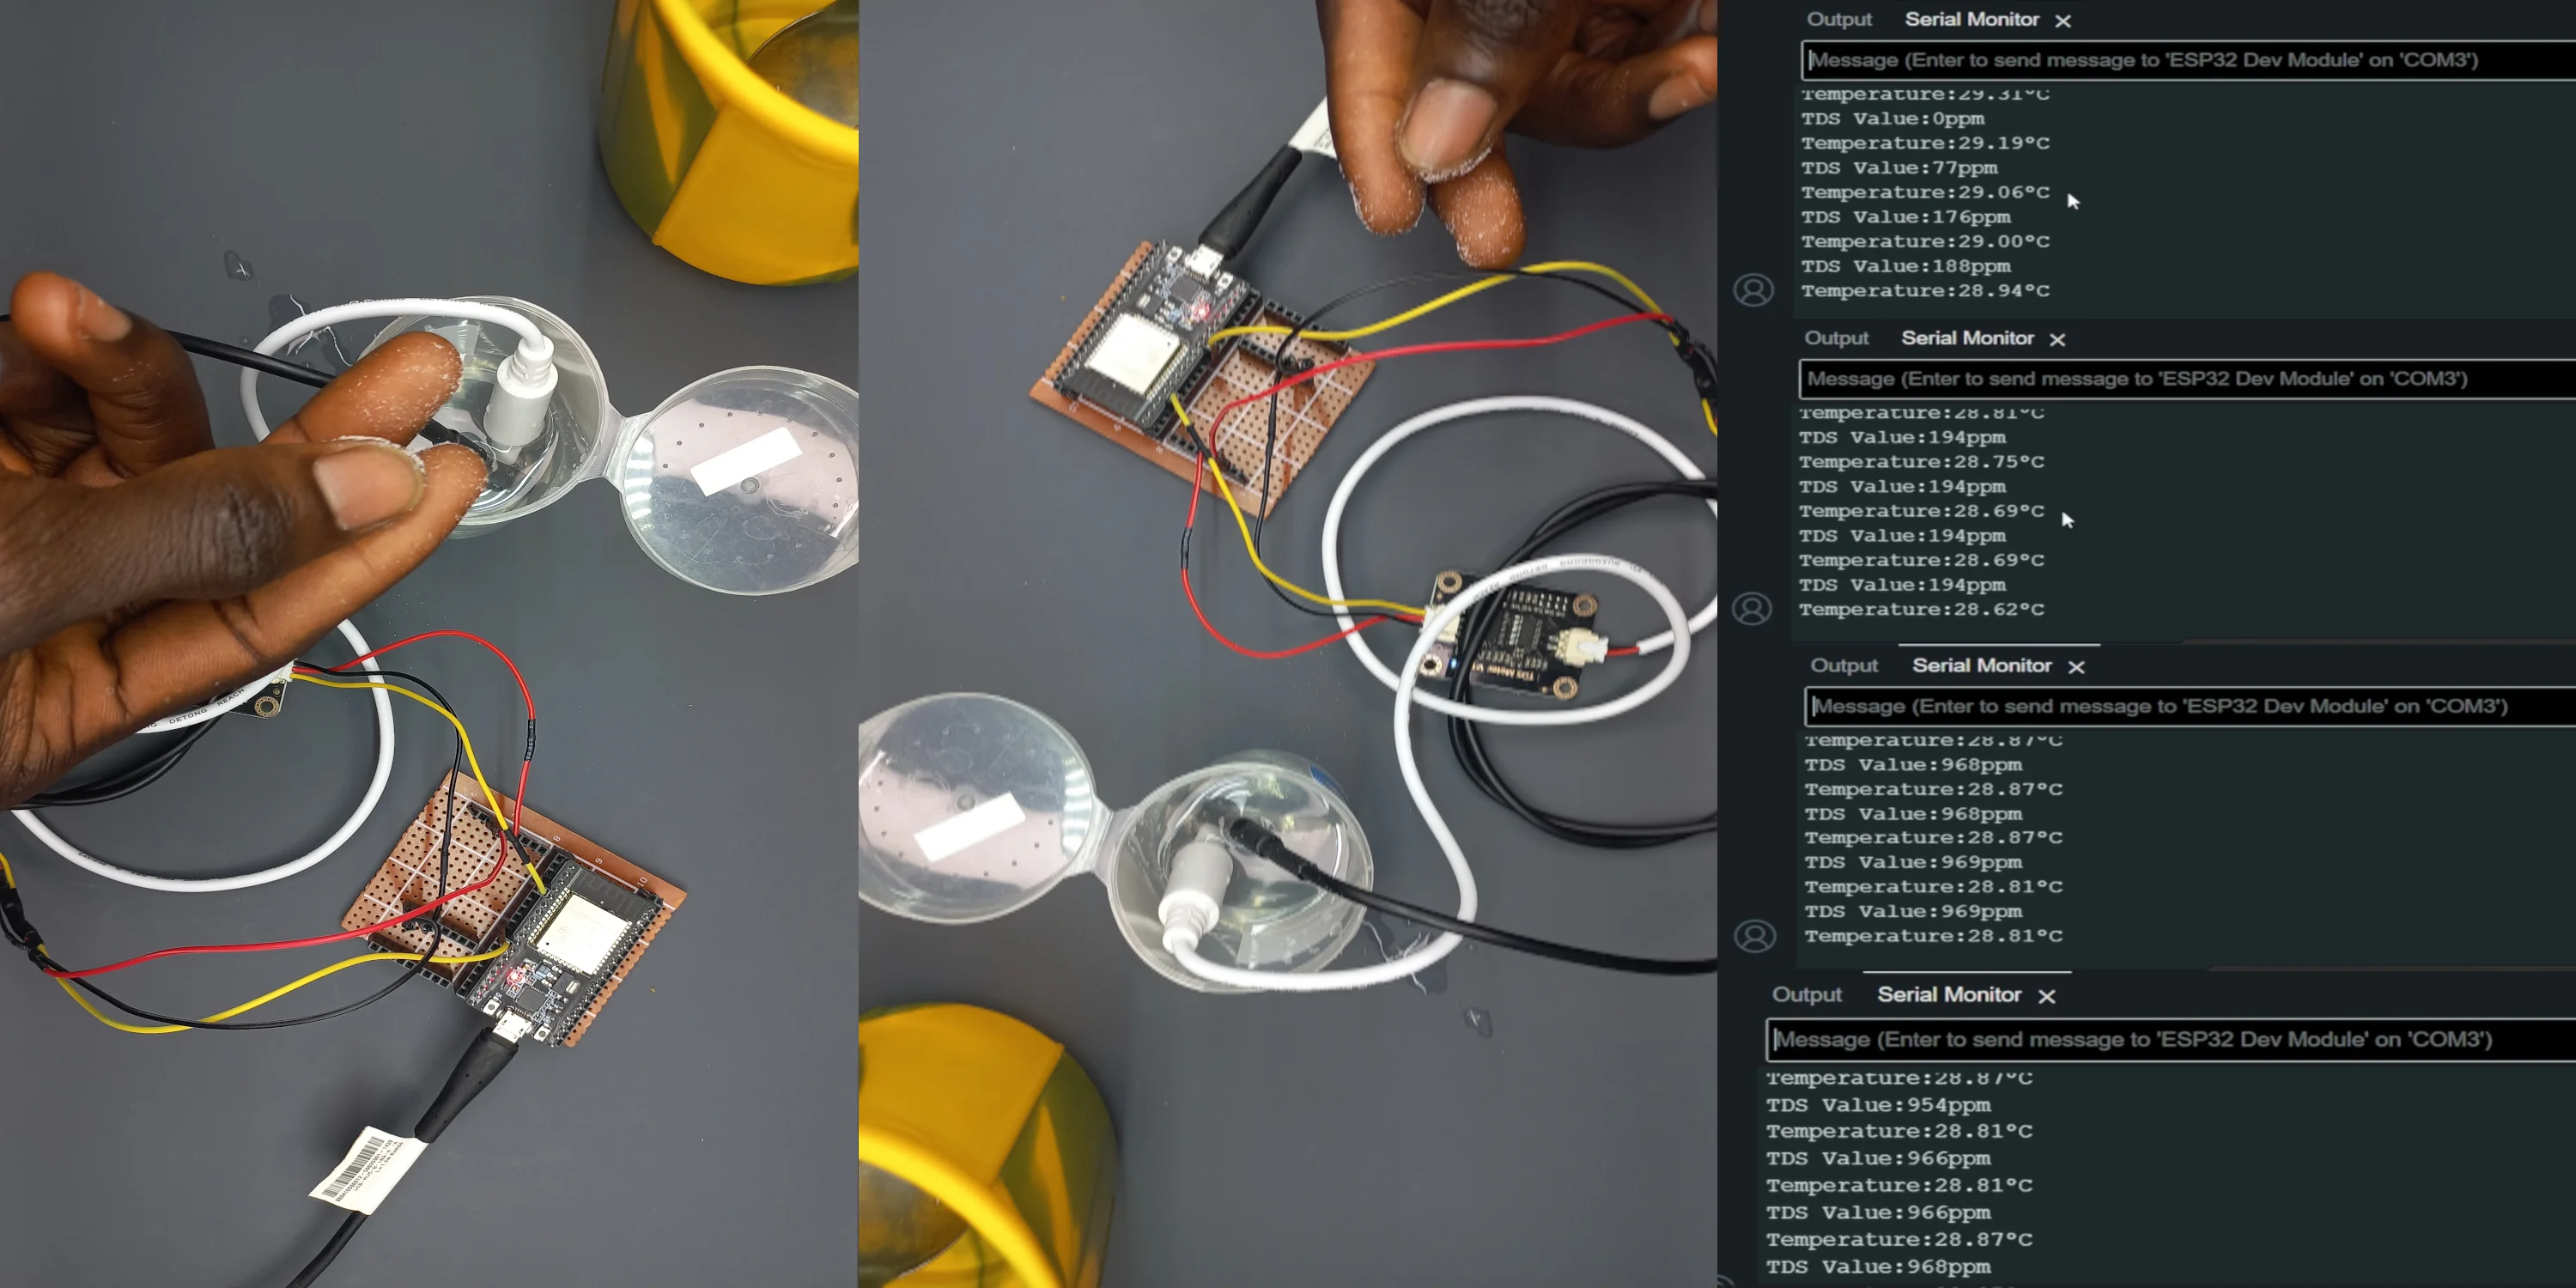
TDS Sensor Guage Result Displayed at 967ppm (for high concentration of
Salt)
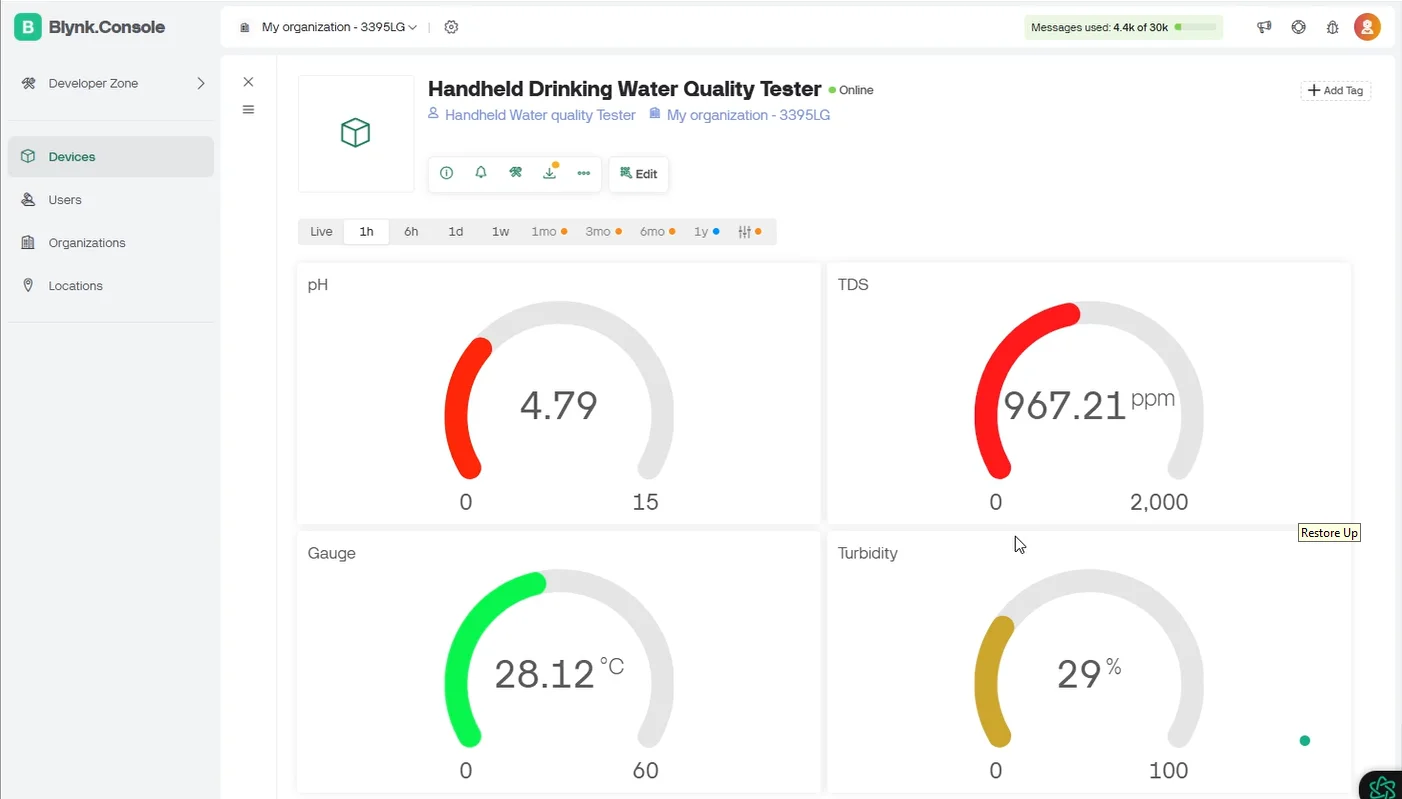
Turbidity Sensor in Clean Water (processed in percentage)
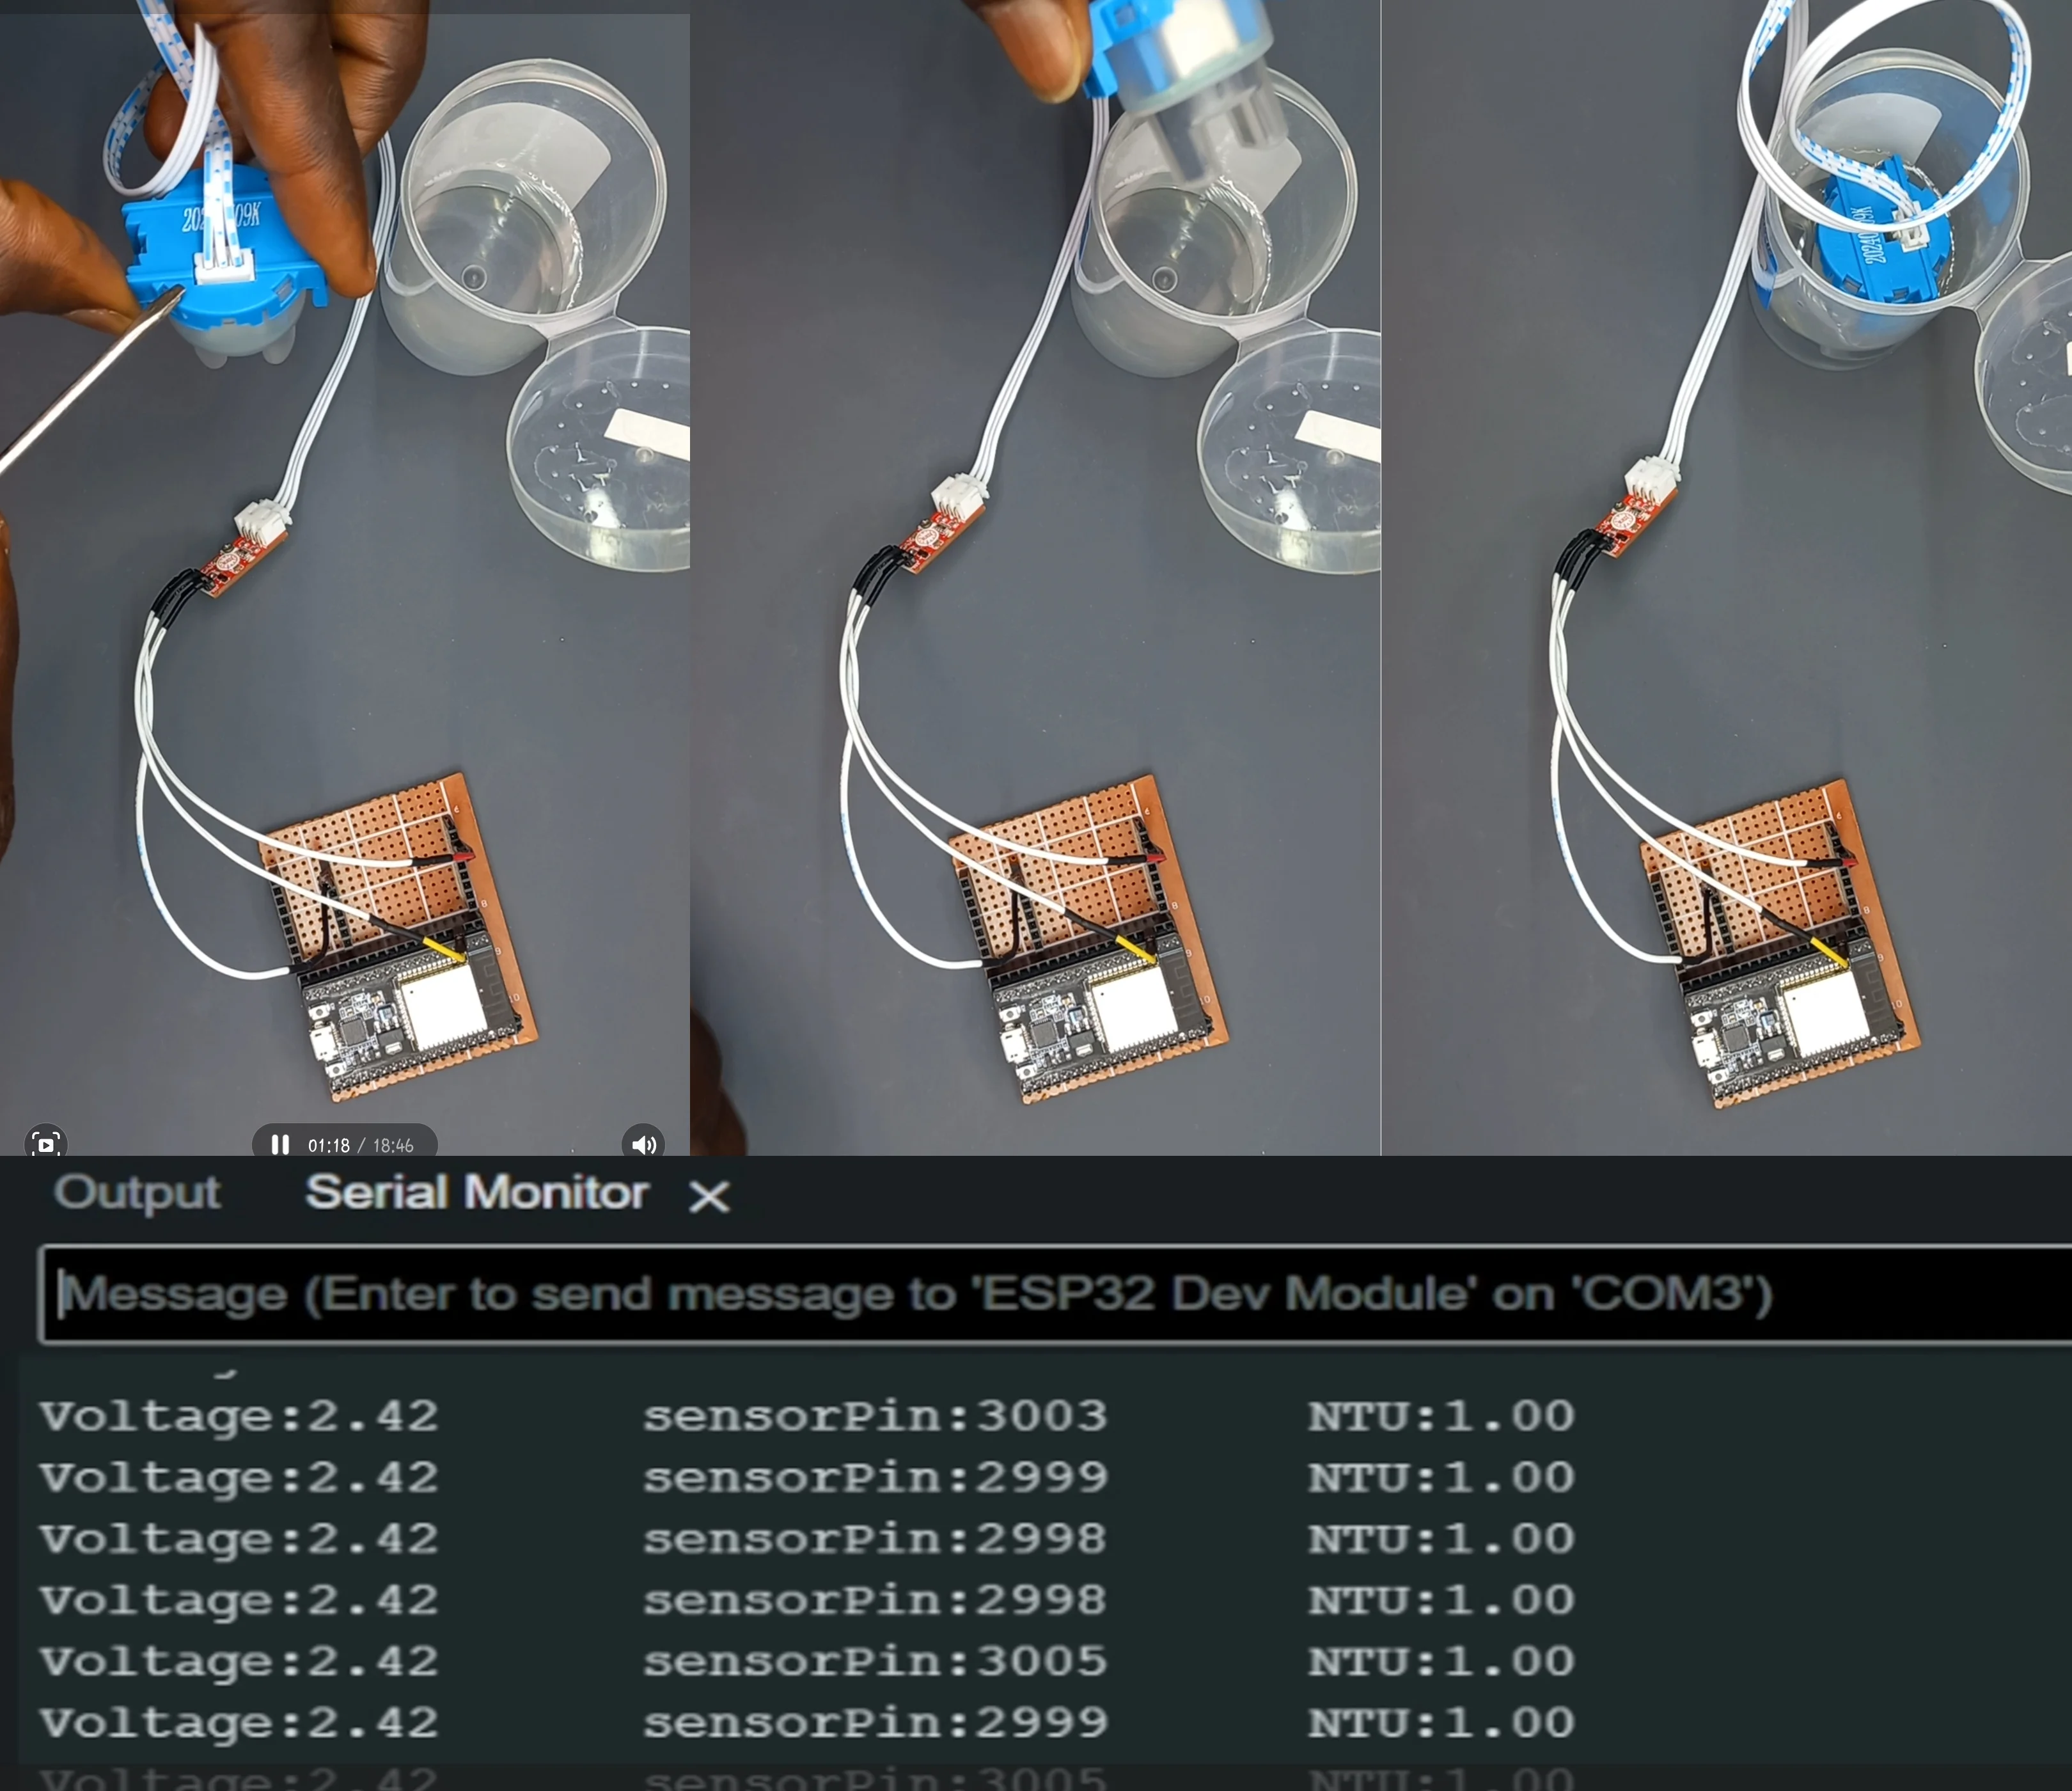
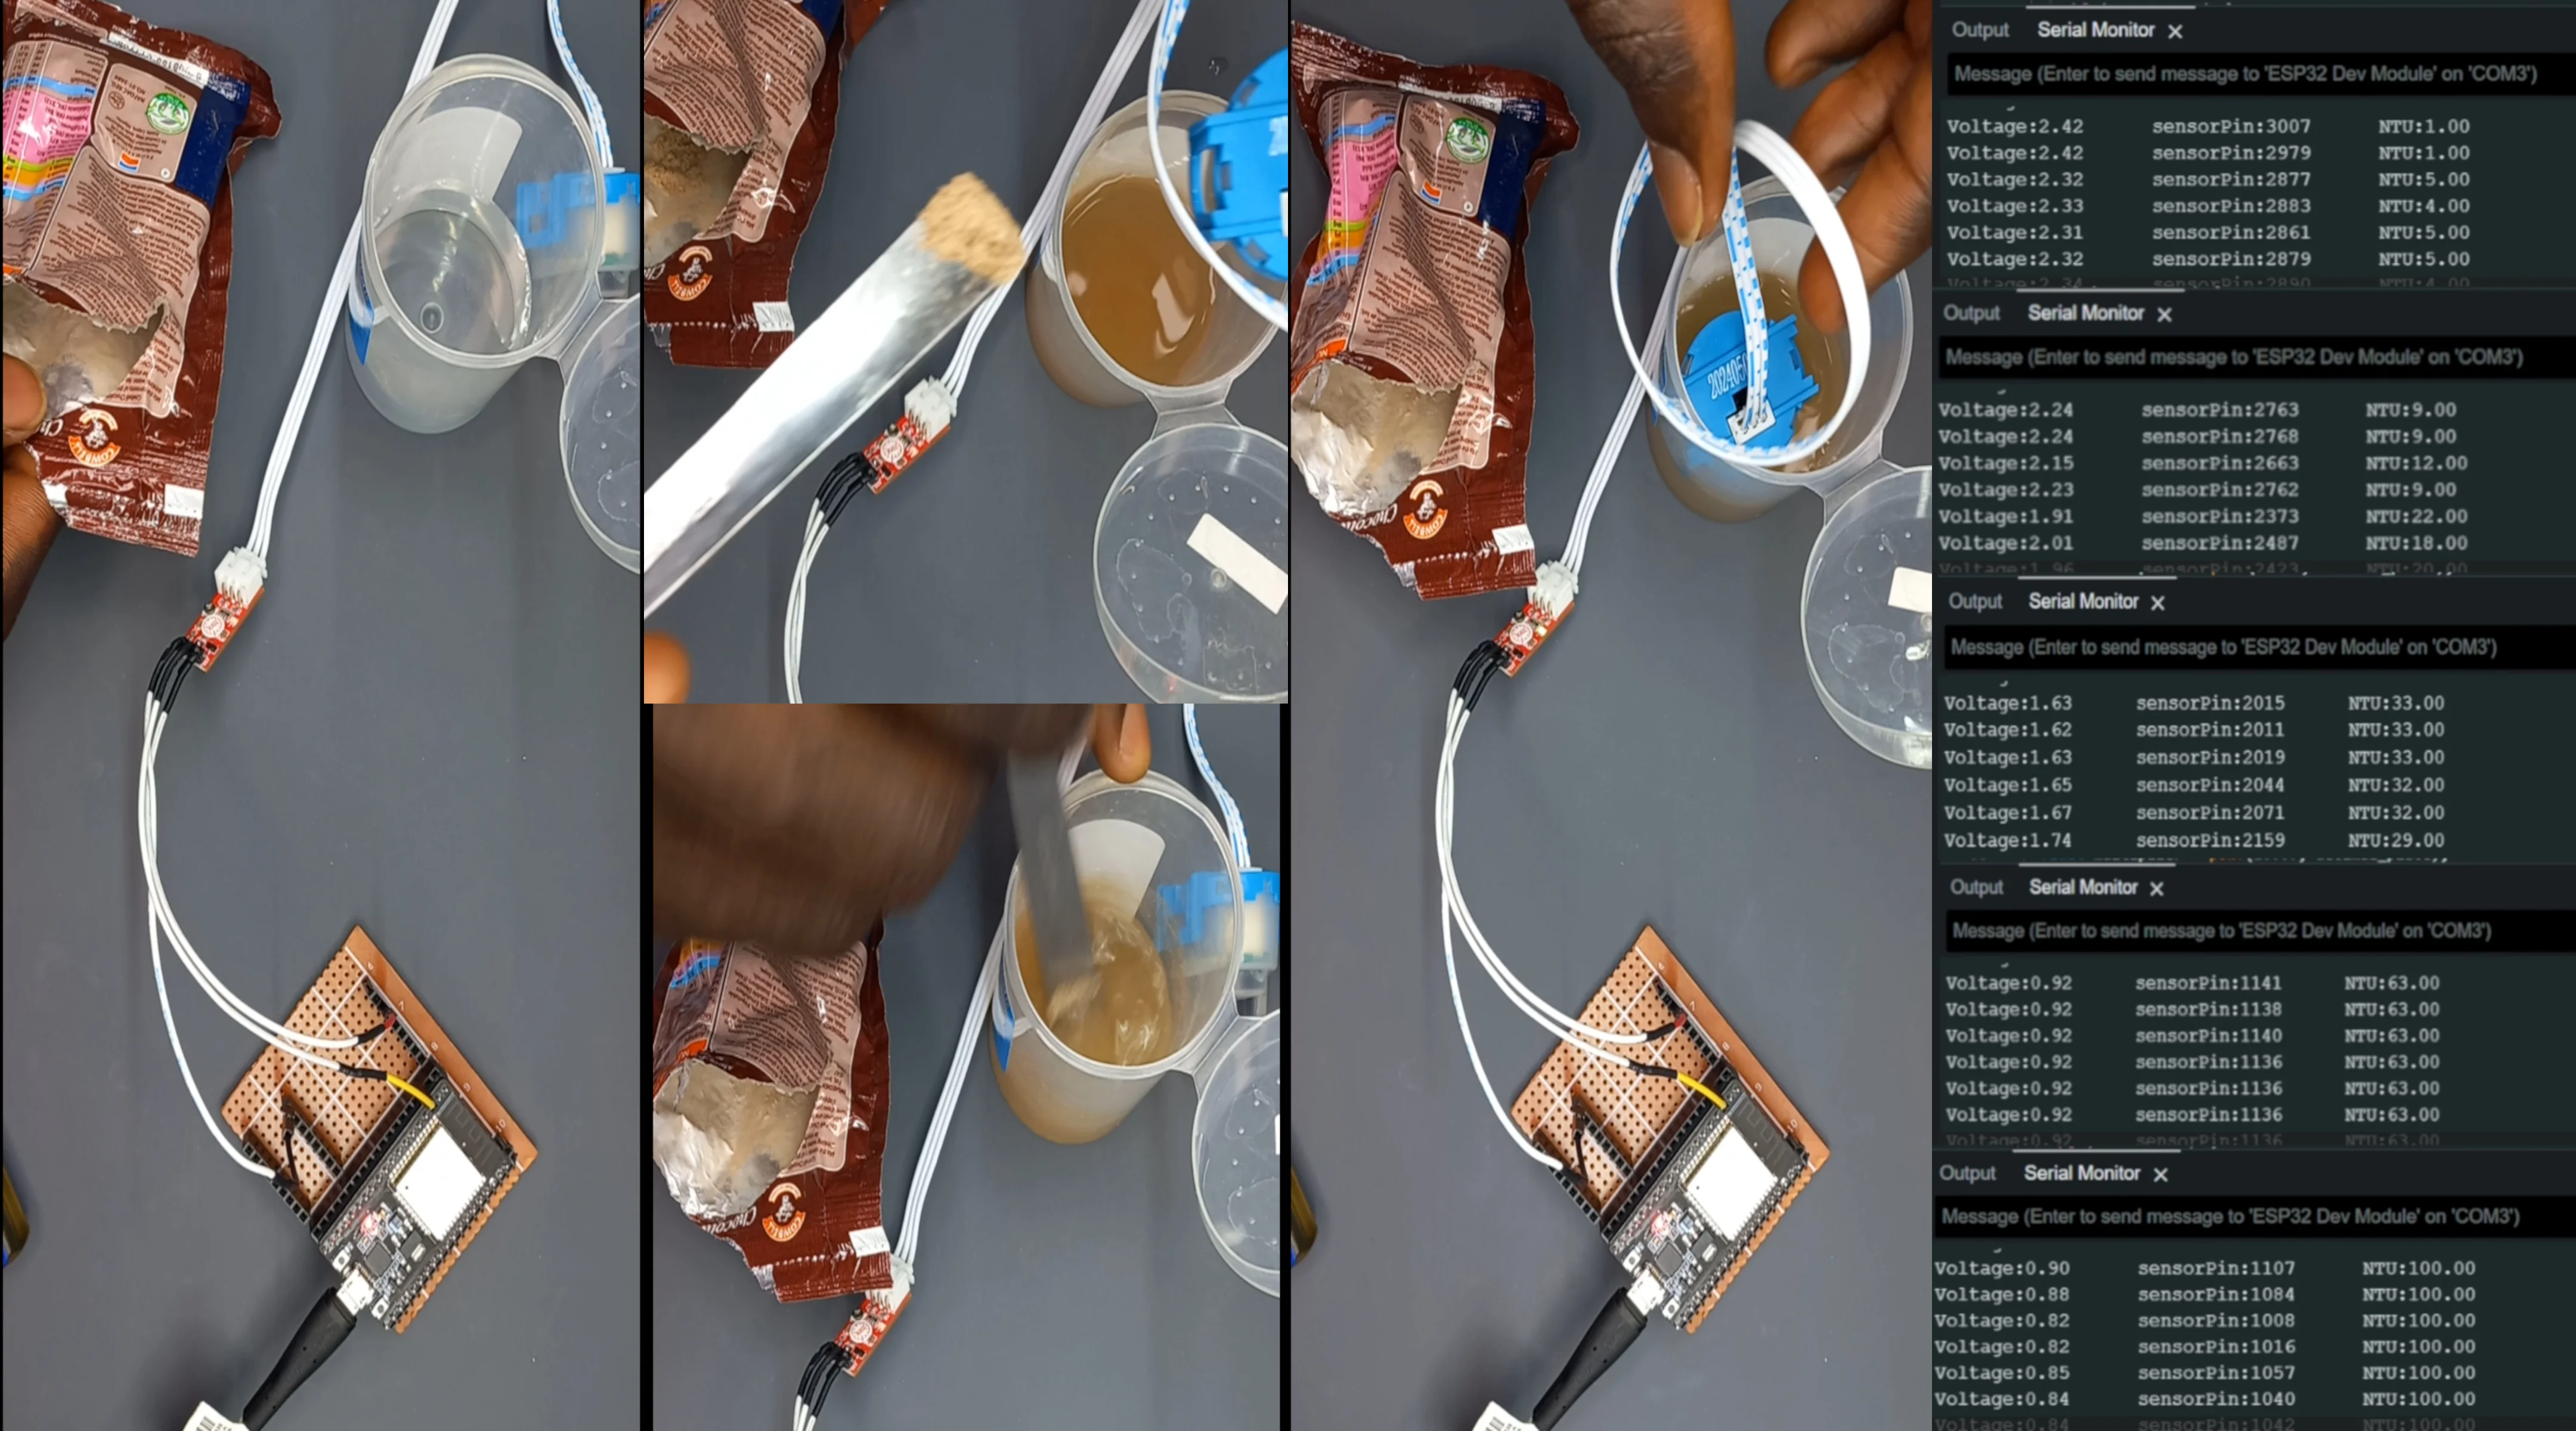
Turbidity Sensor Gradual Increment Result (in percentage) as the Concentration of
Dirt Increases.
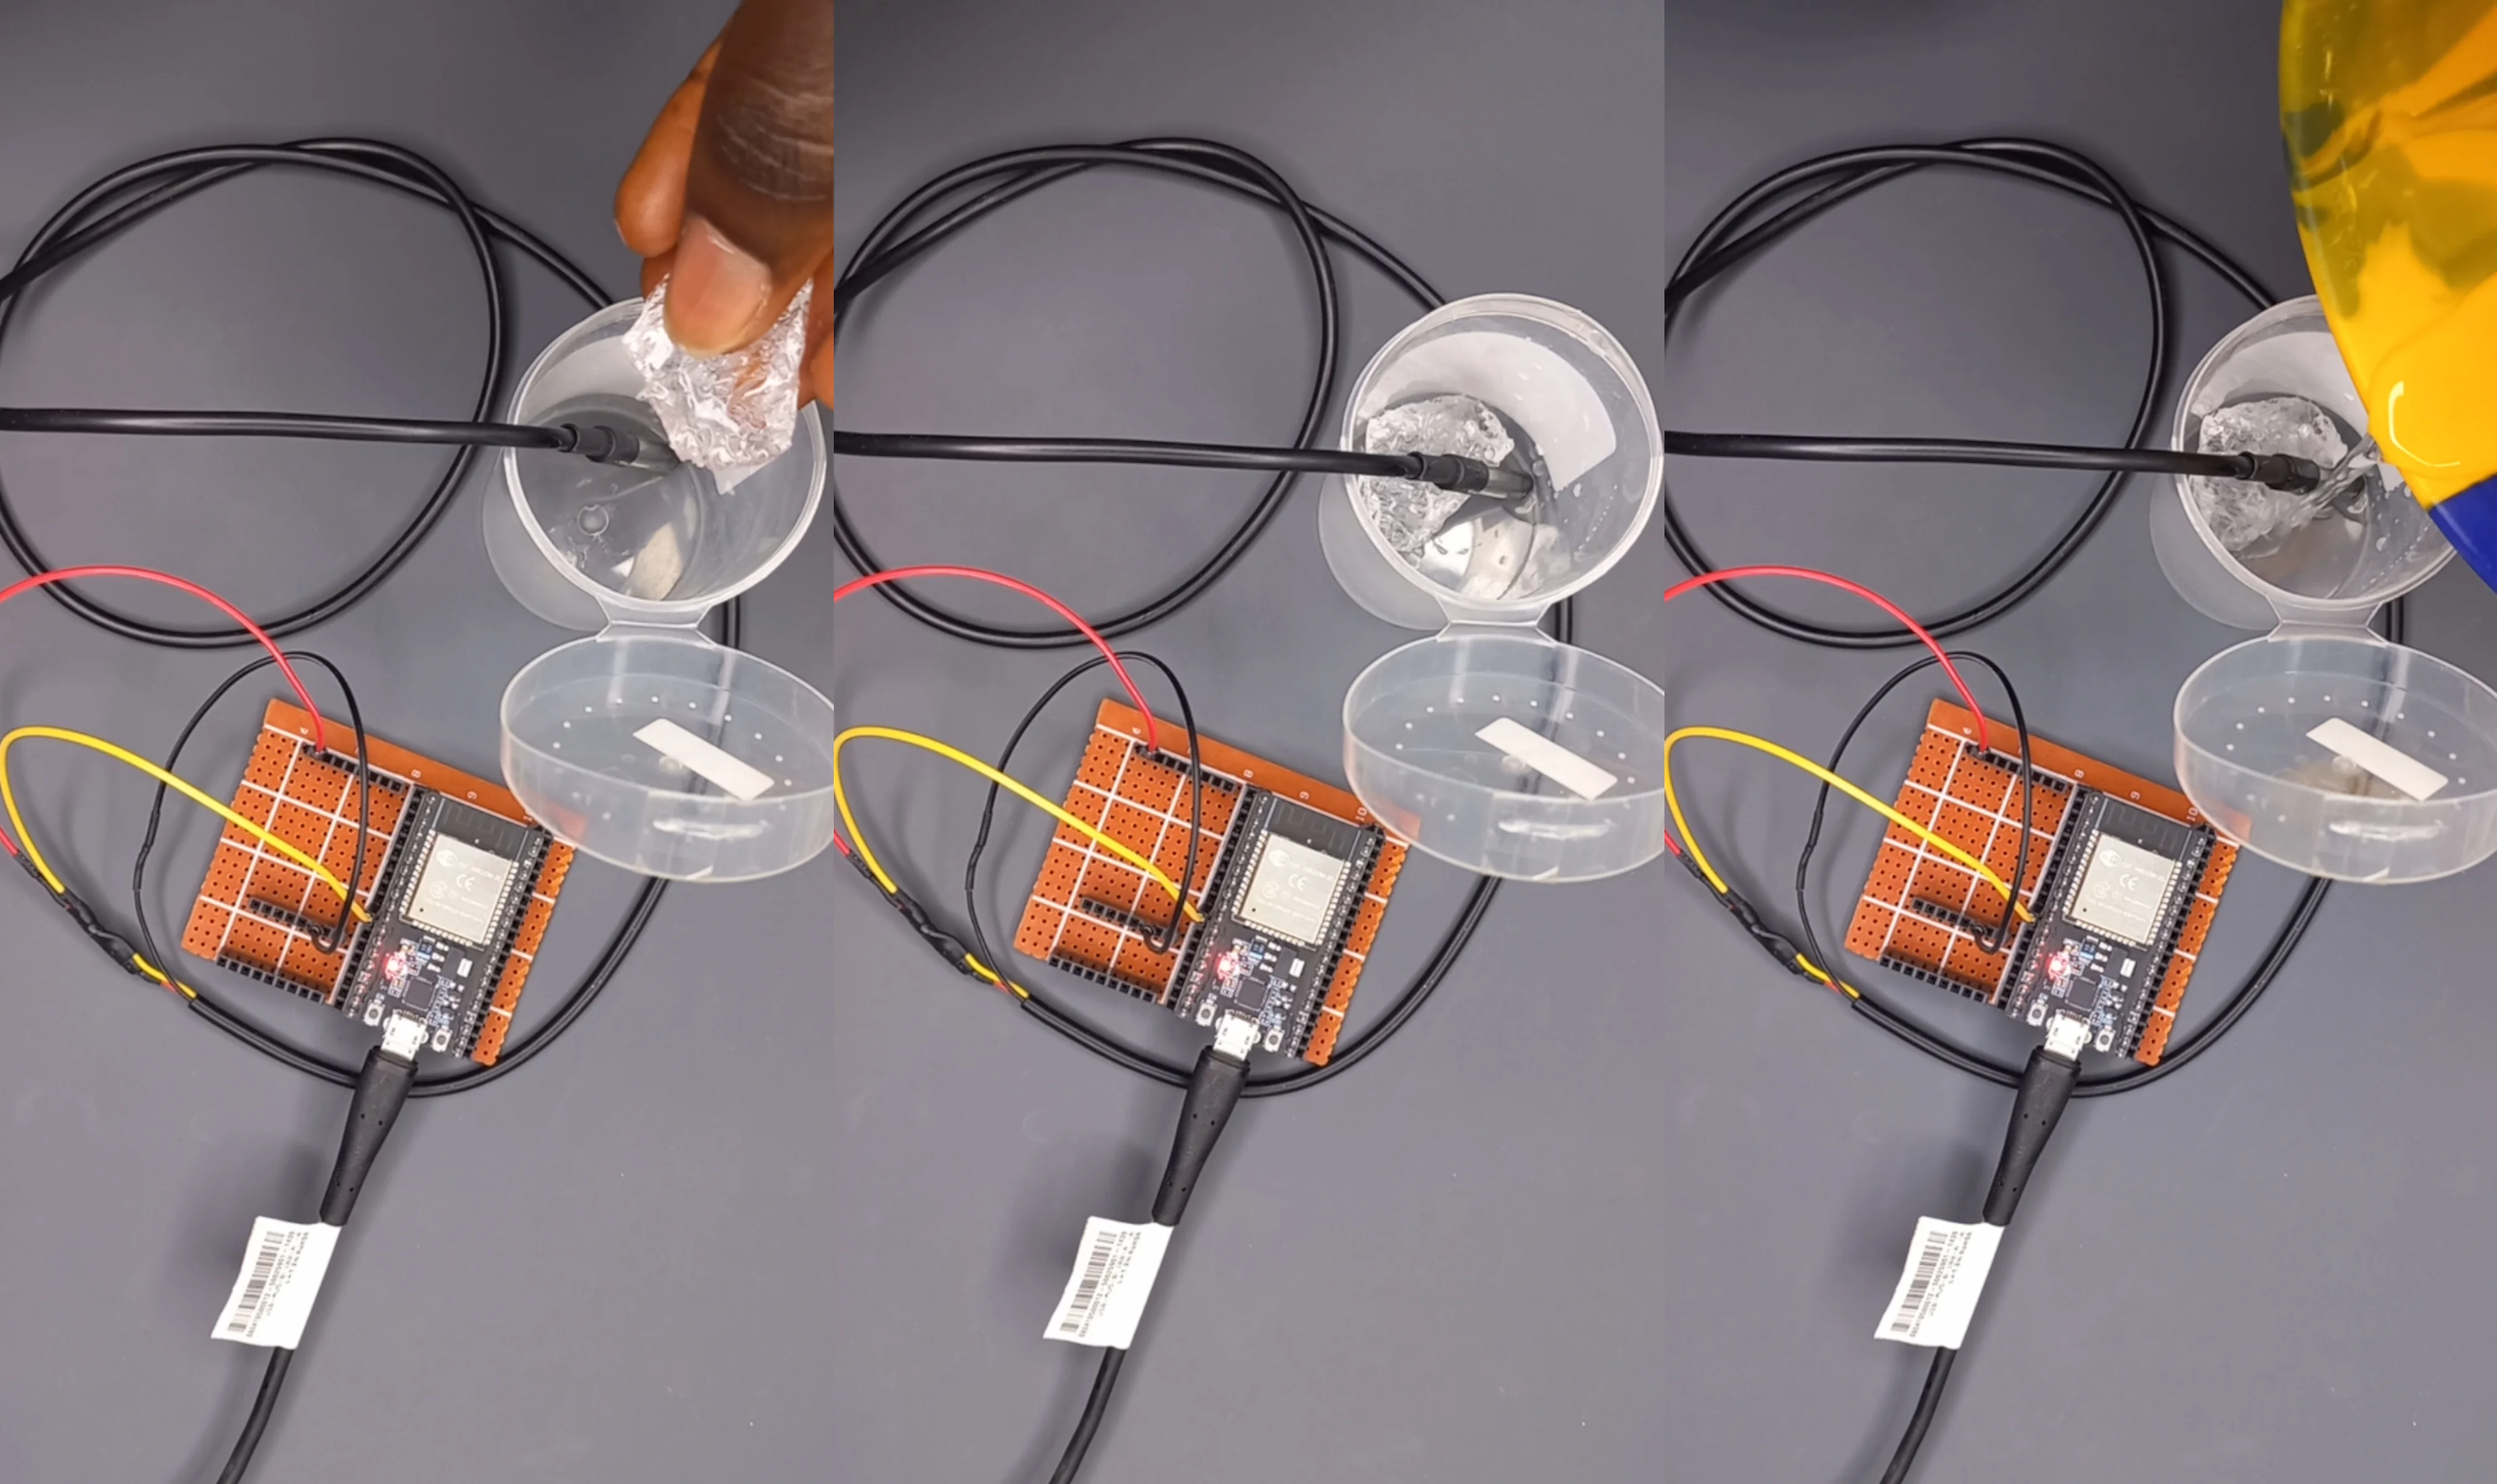
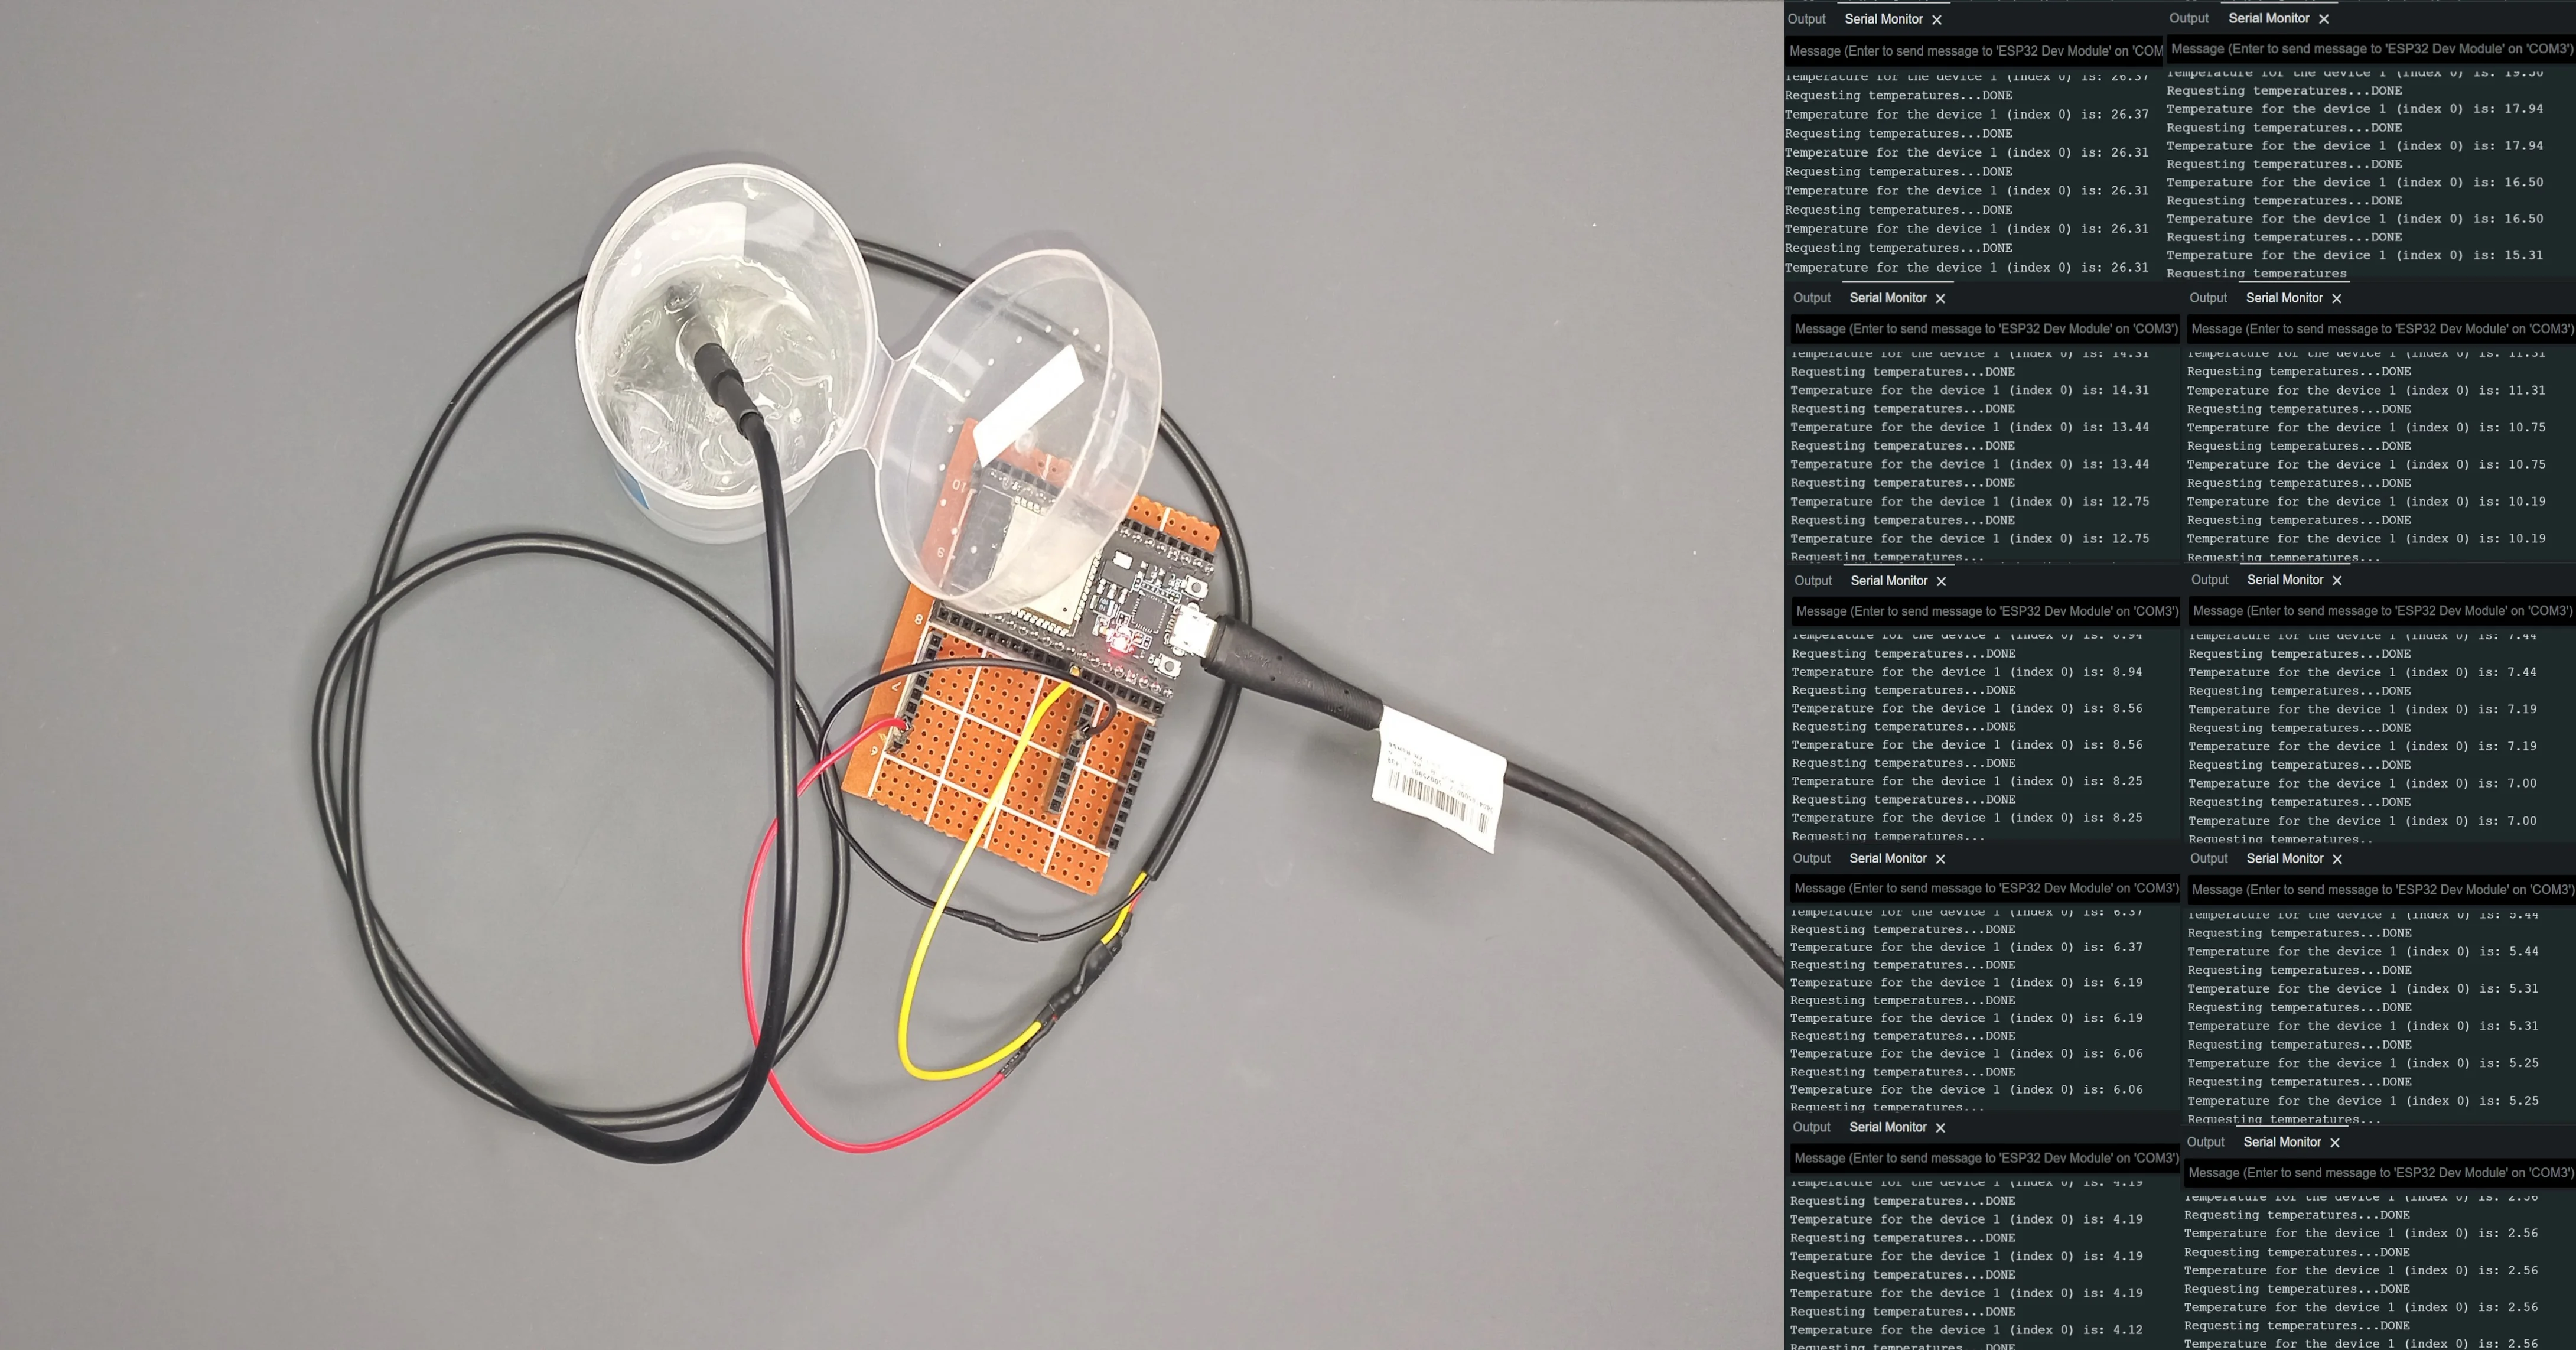
Temperature Sensor in Warm or Room Temperature Water
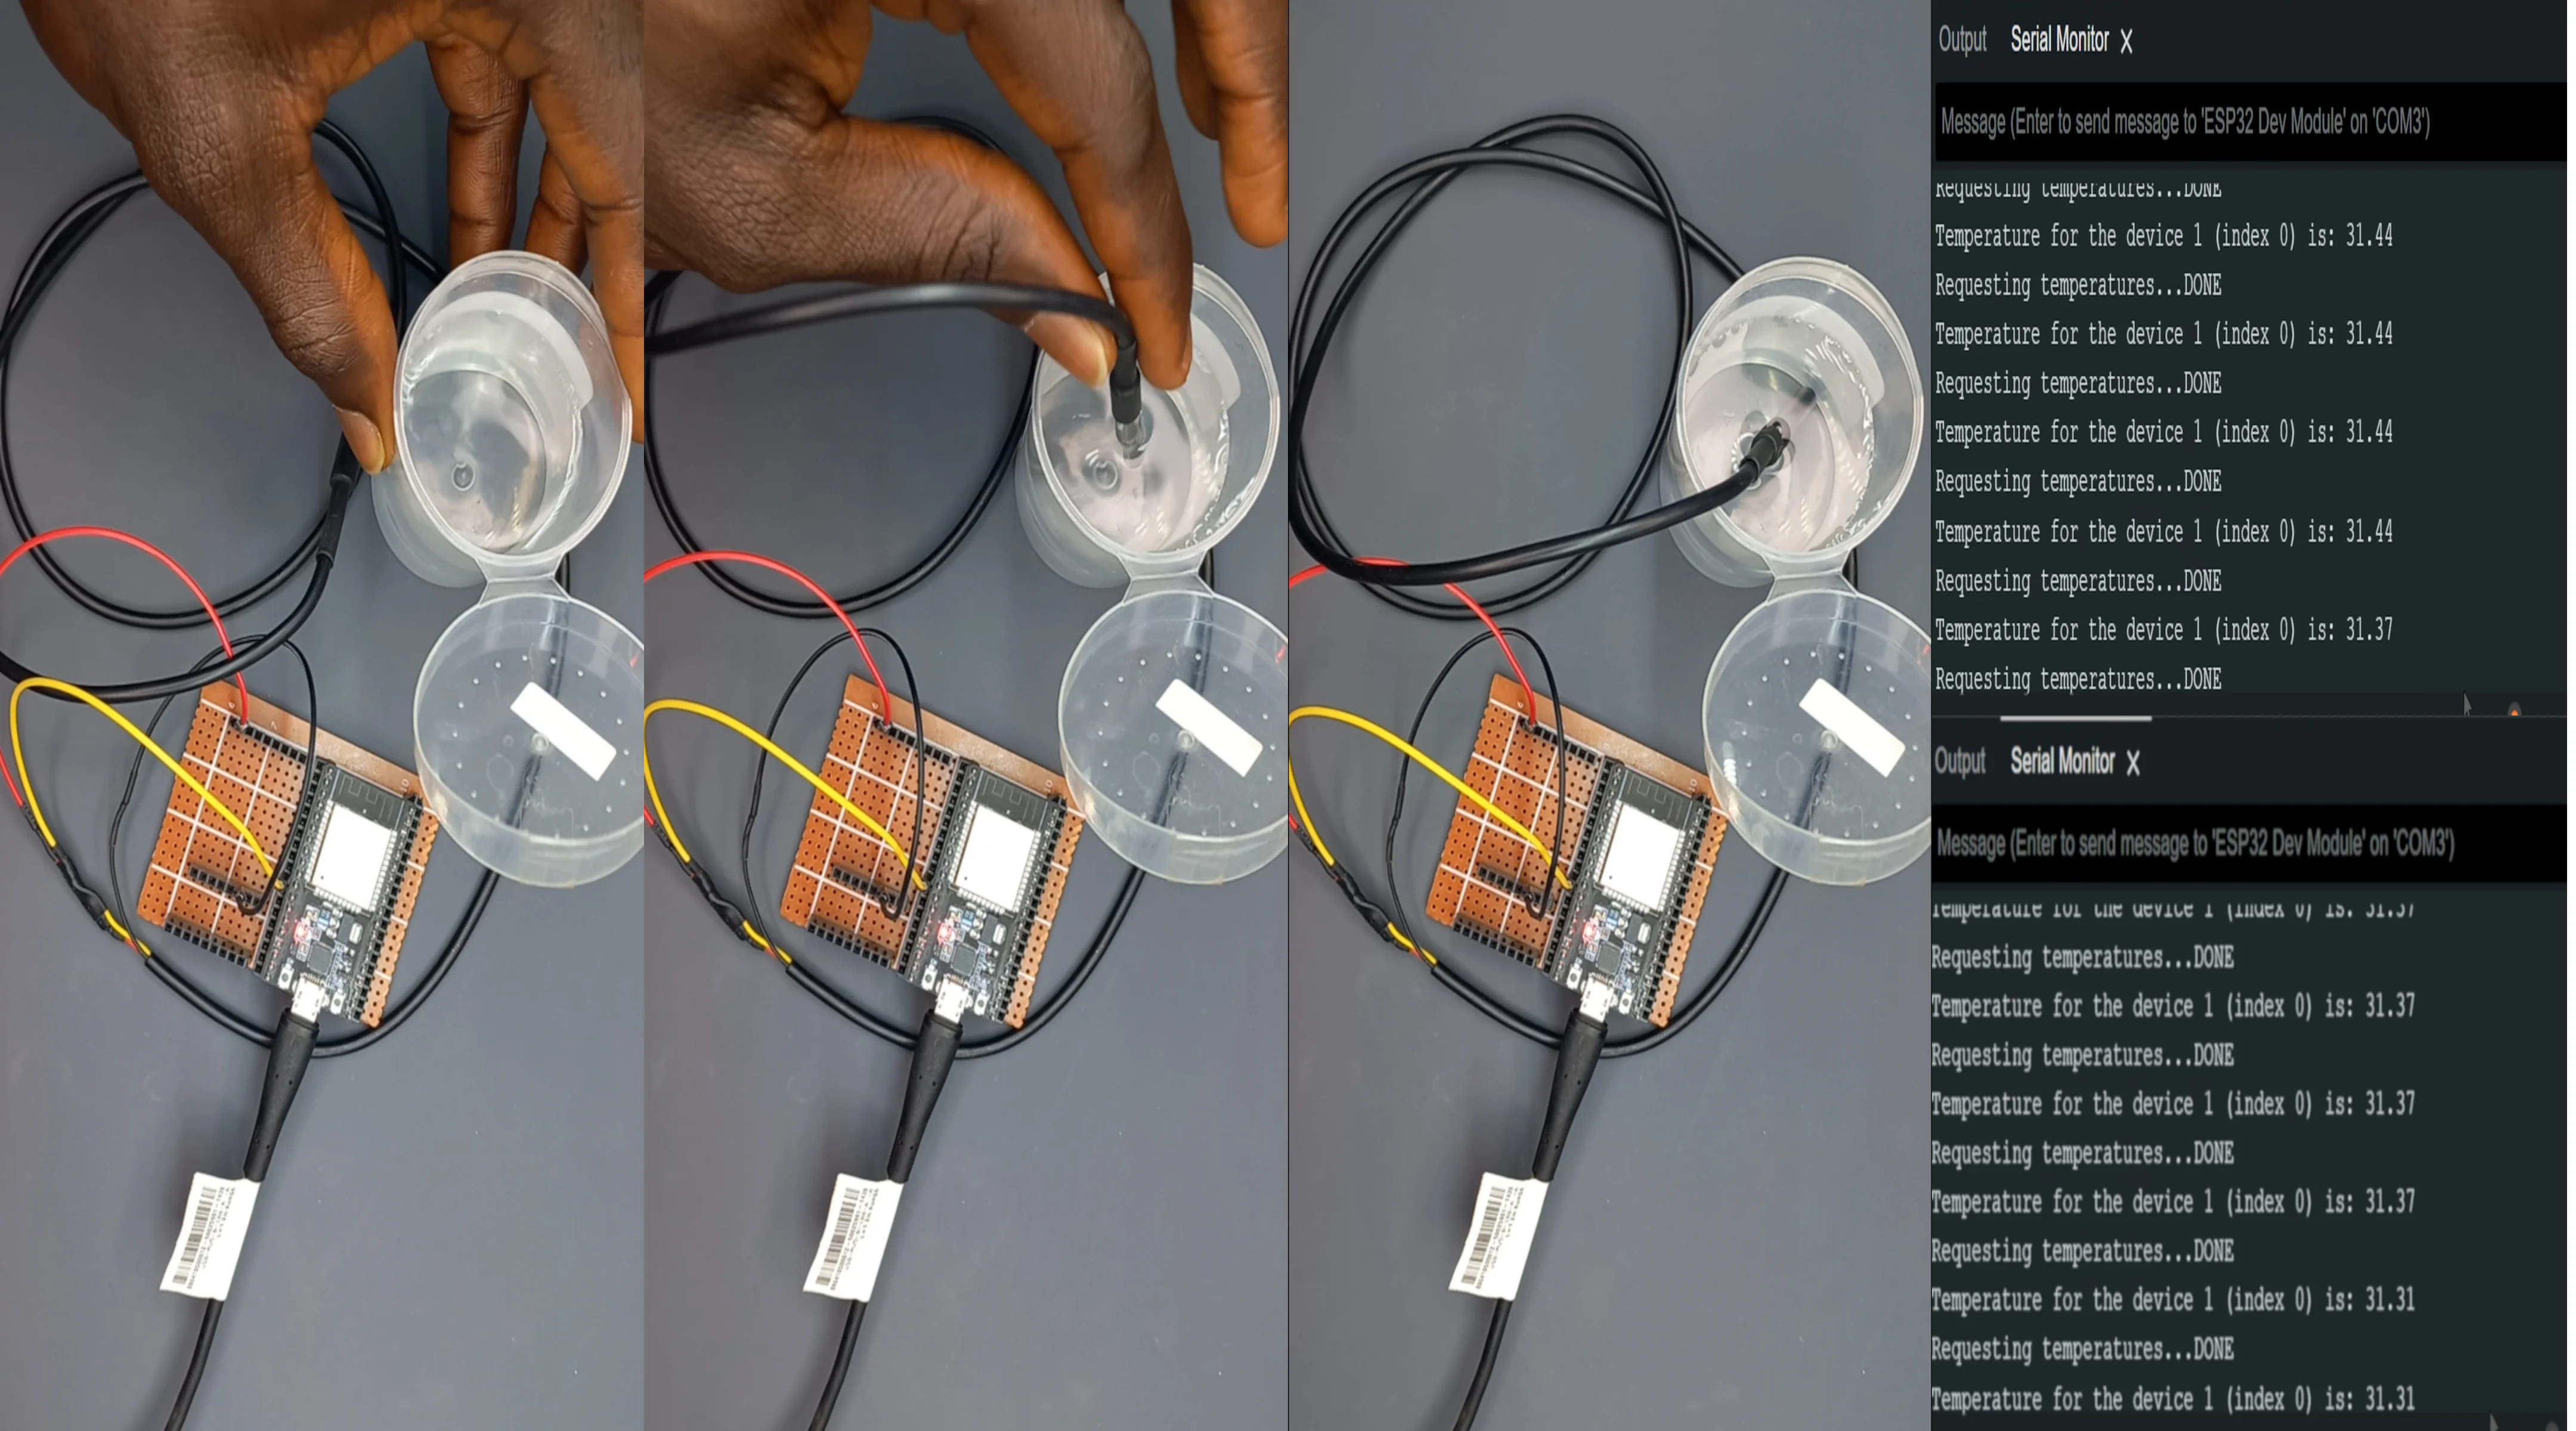
Temperature Sensor in Iced Water (Low Temperature)
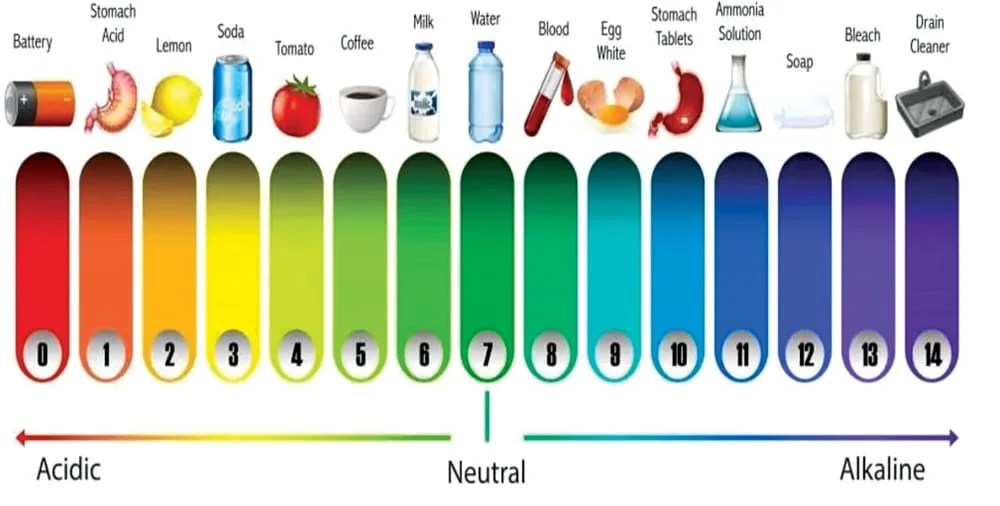
Typical pH Scale
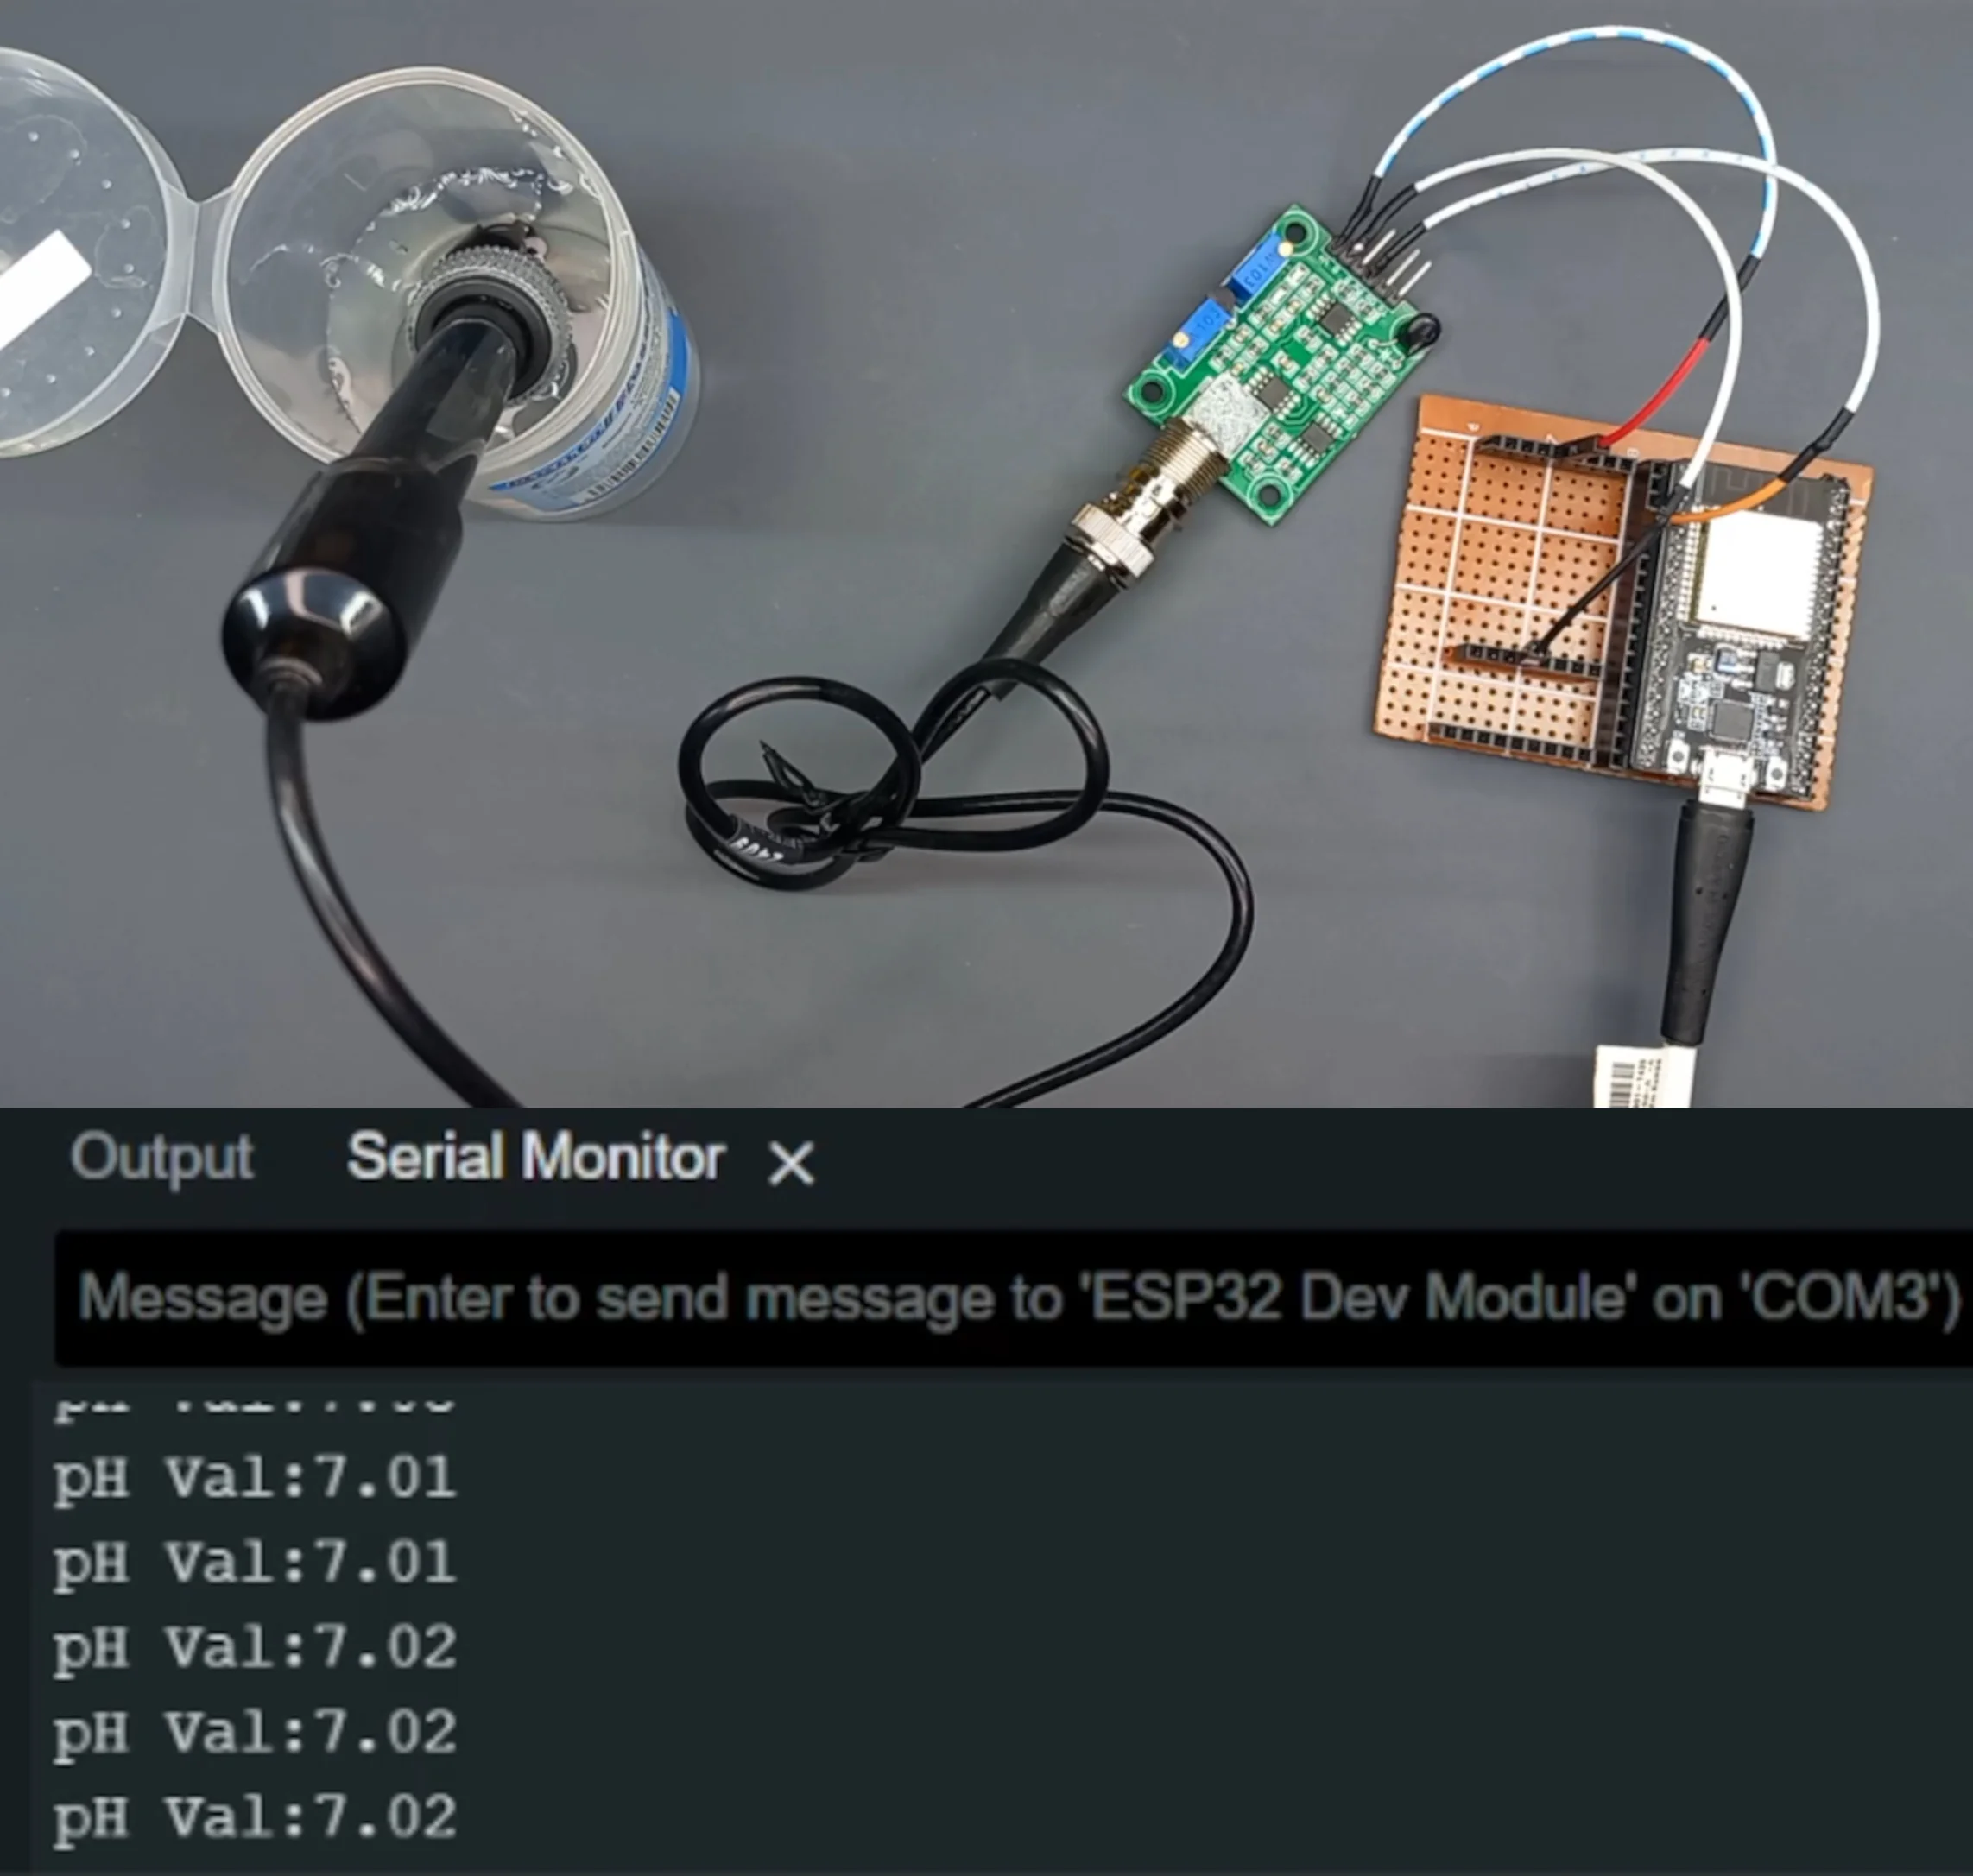
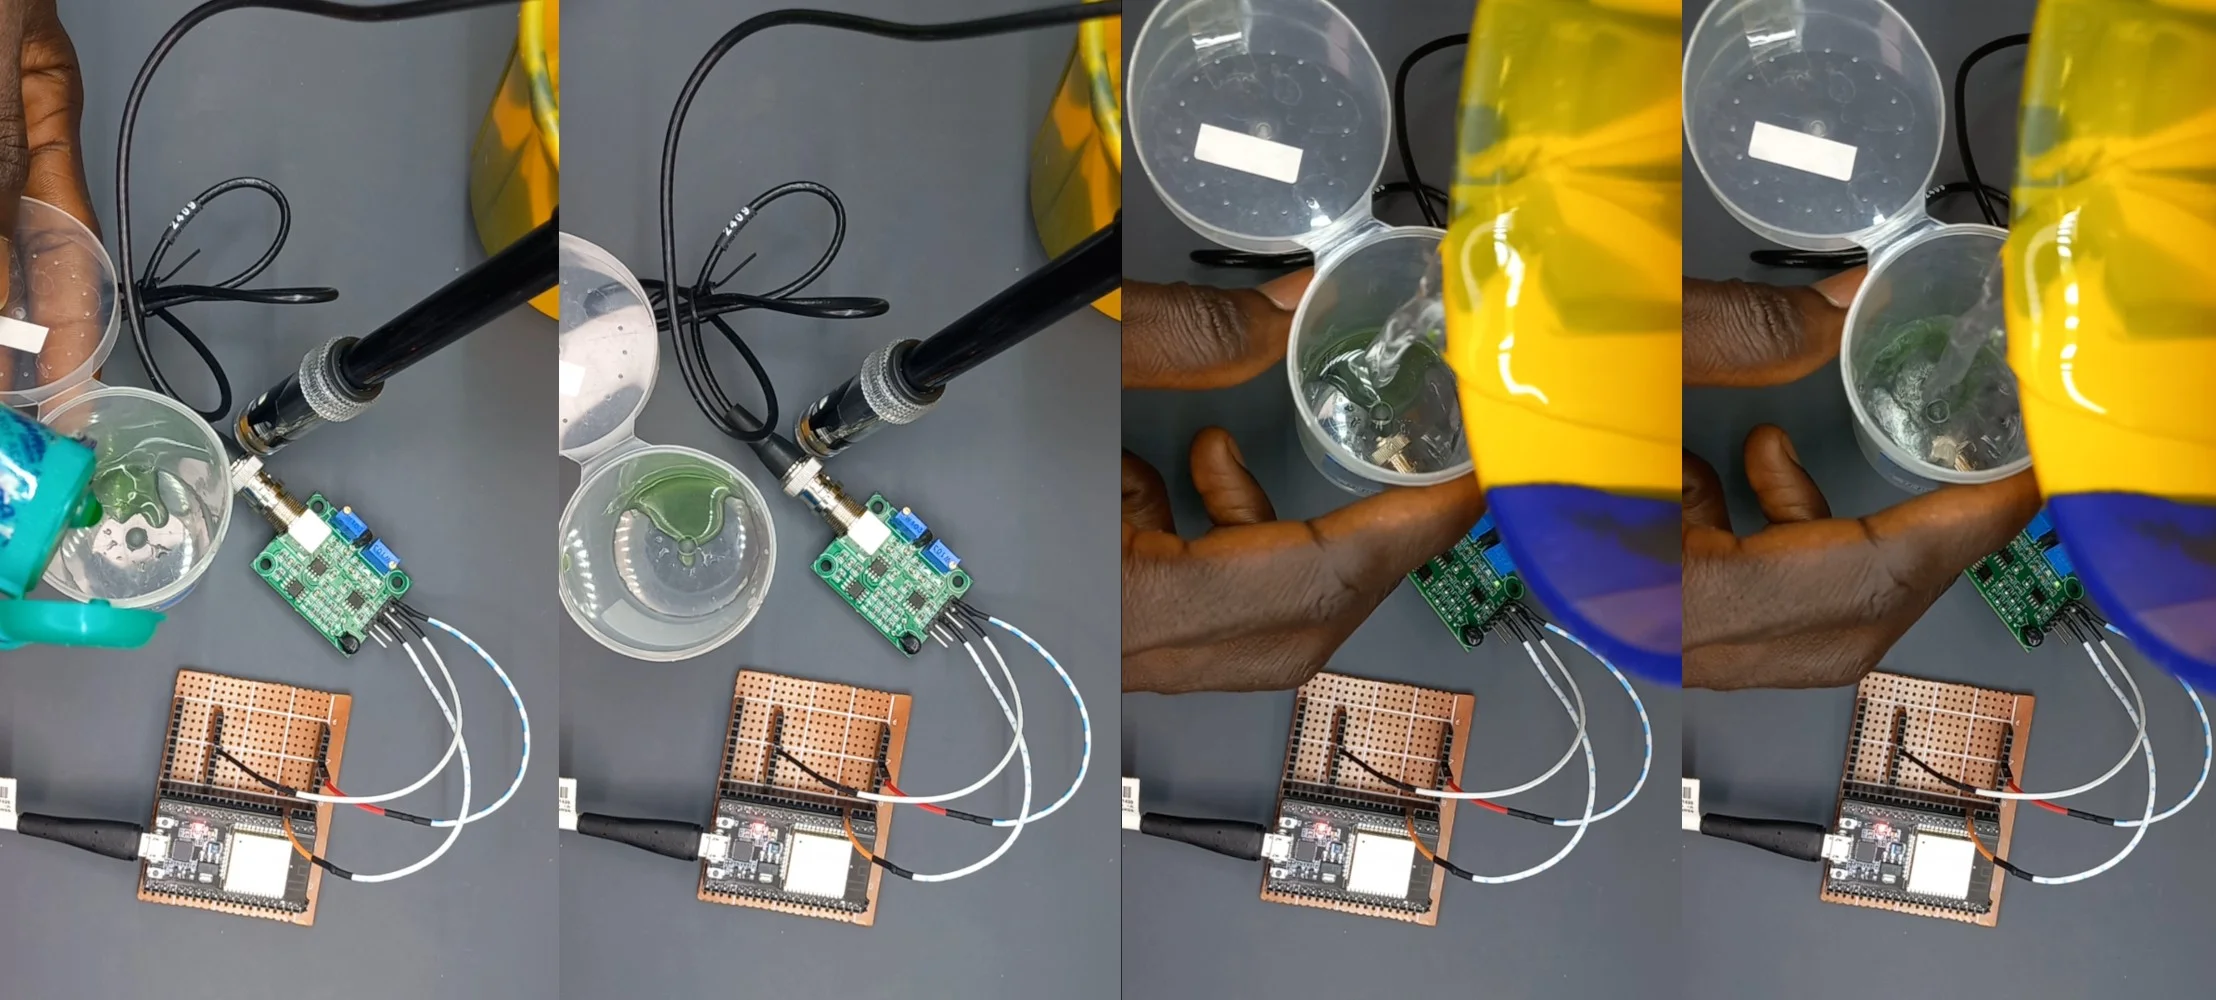
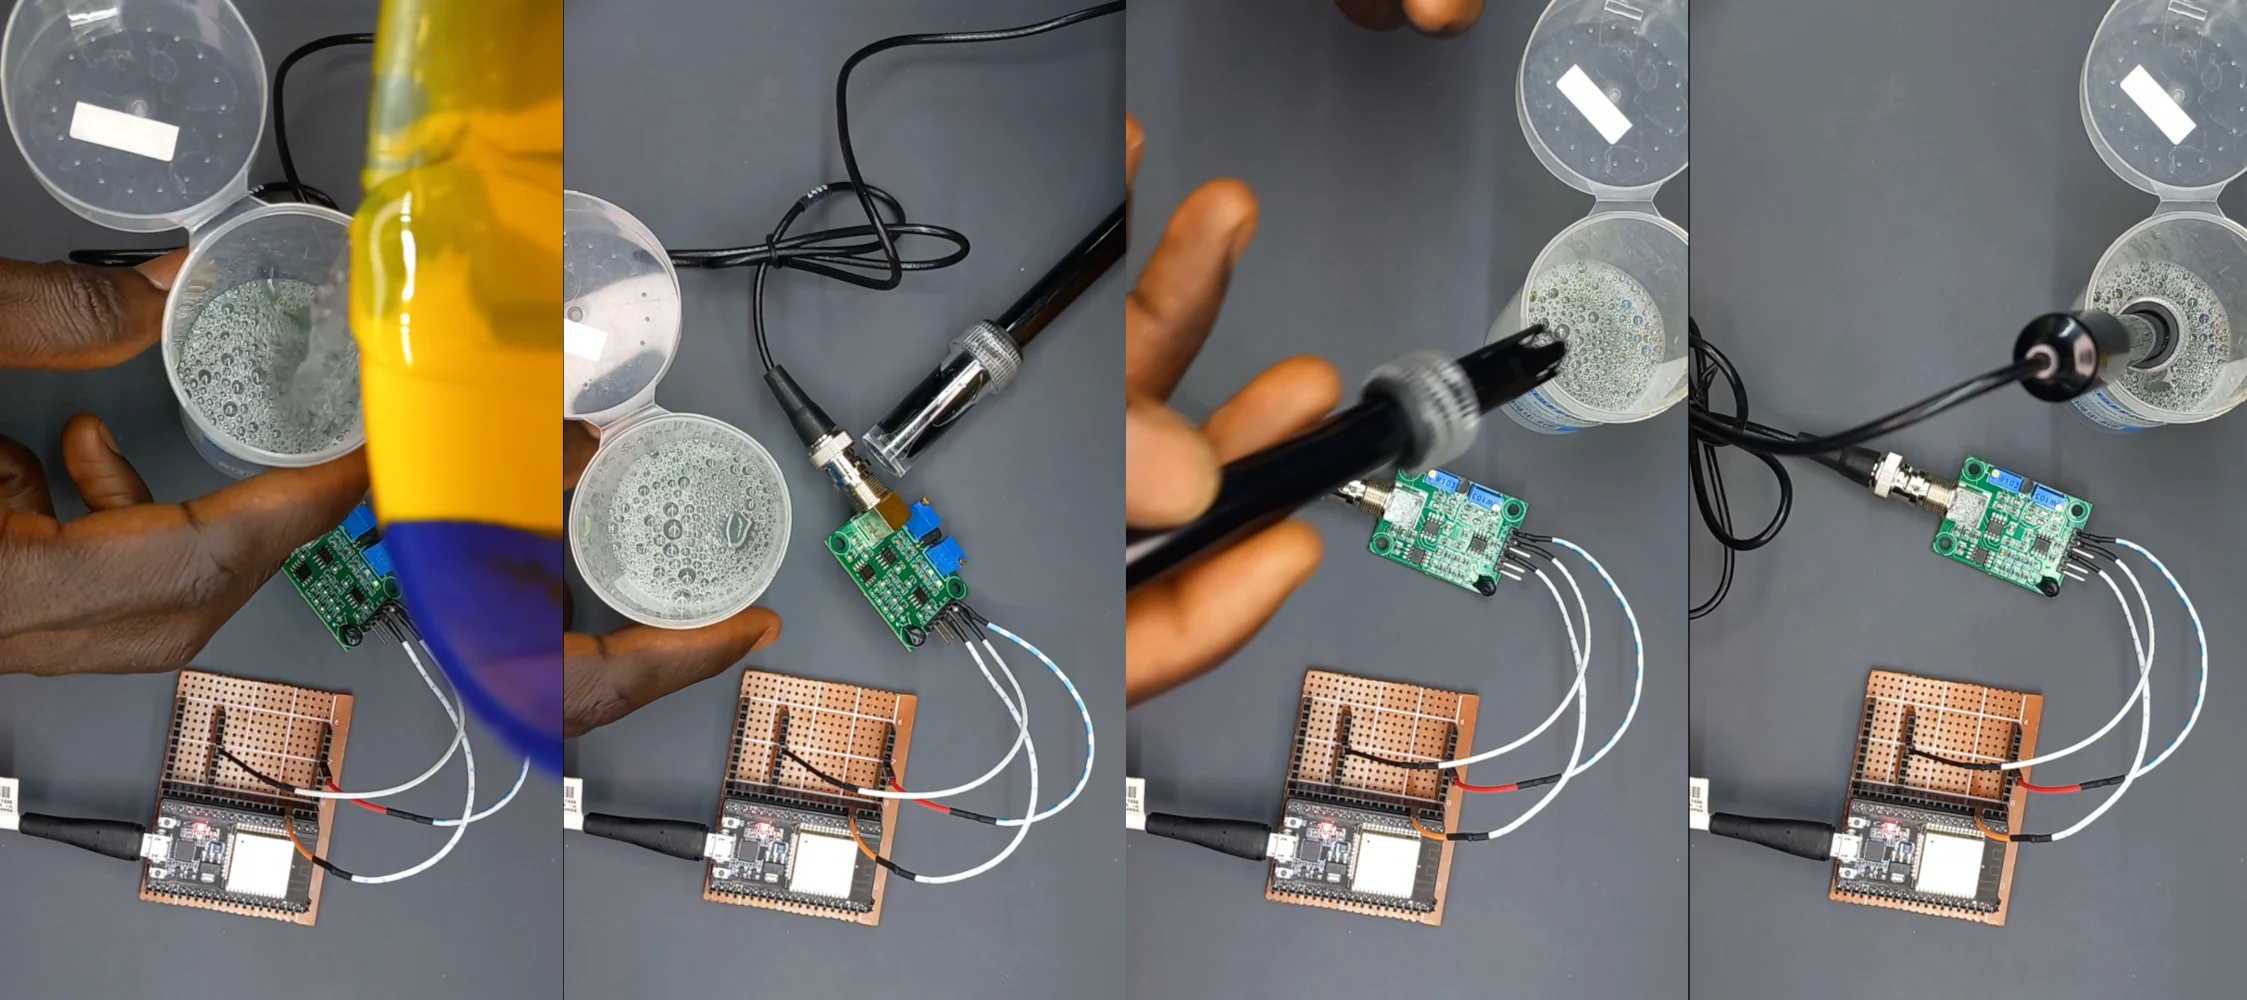
pH Sensor in Pure Water
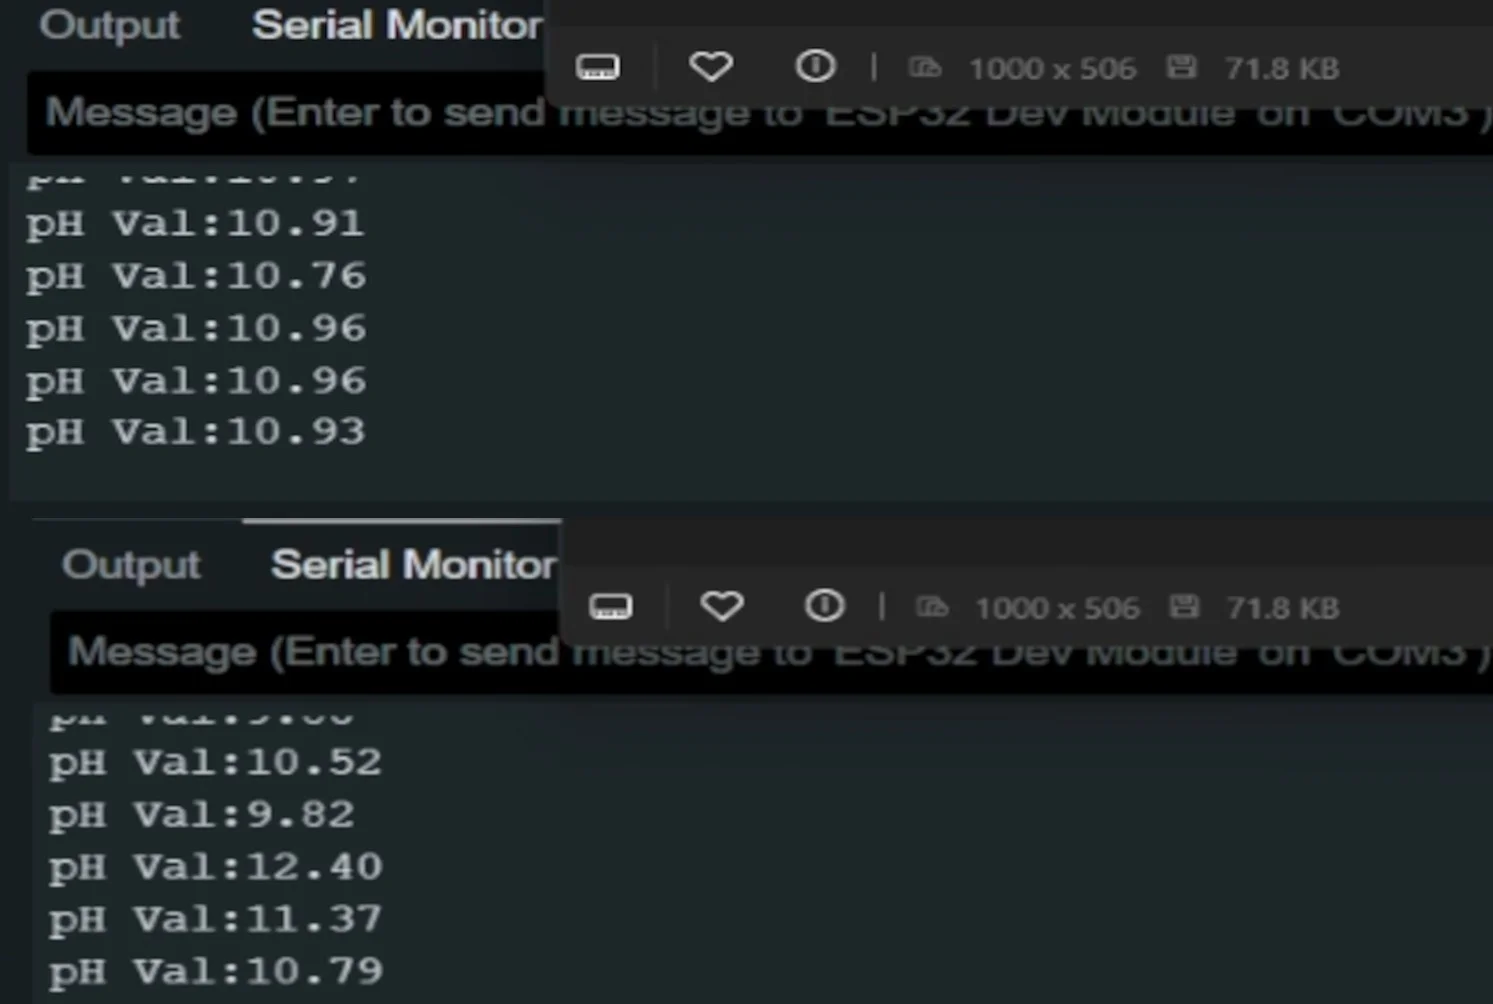
pH Sensor in Soapy Water
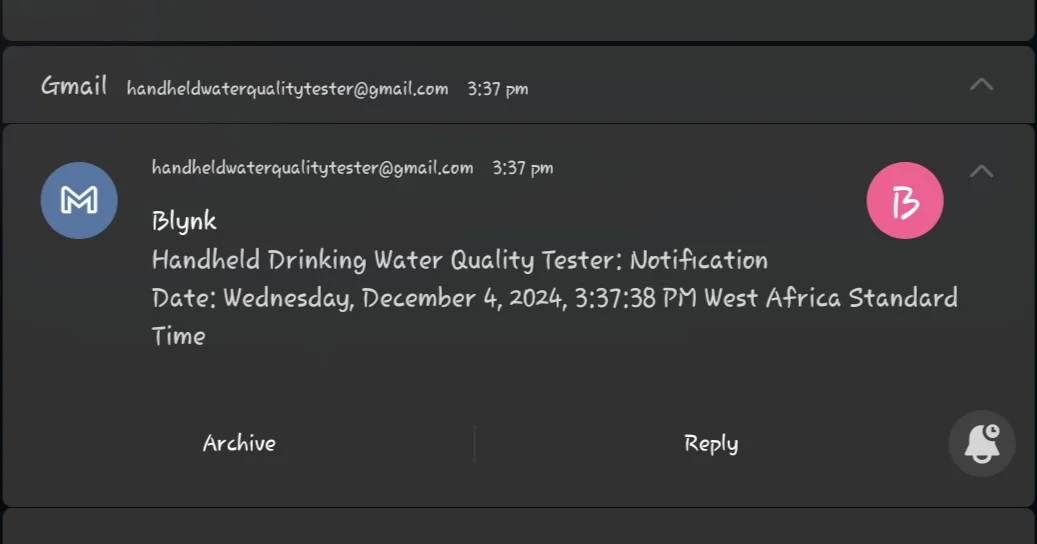
The Gmail Notification for When the Device Gets Powered and Connected to the
Internet
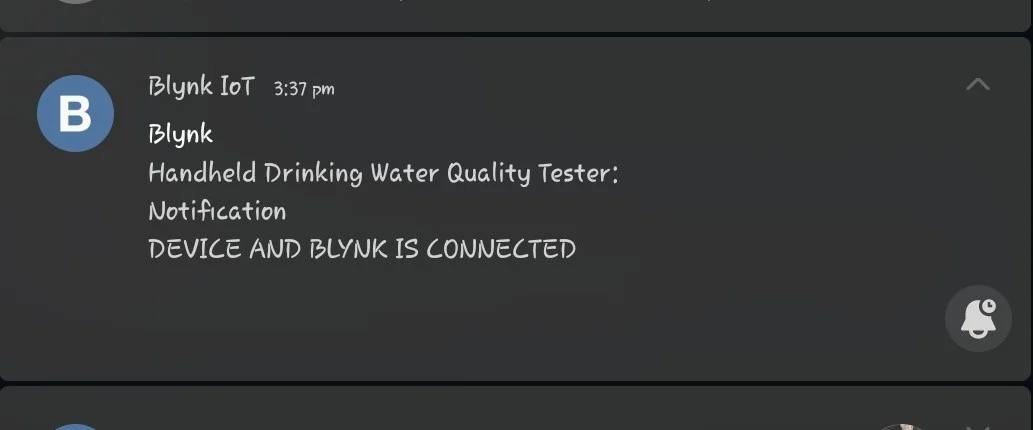
The Message Body of the Email
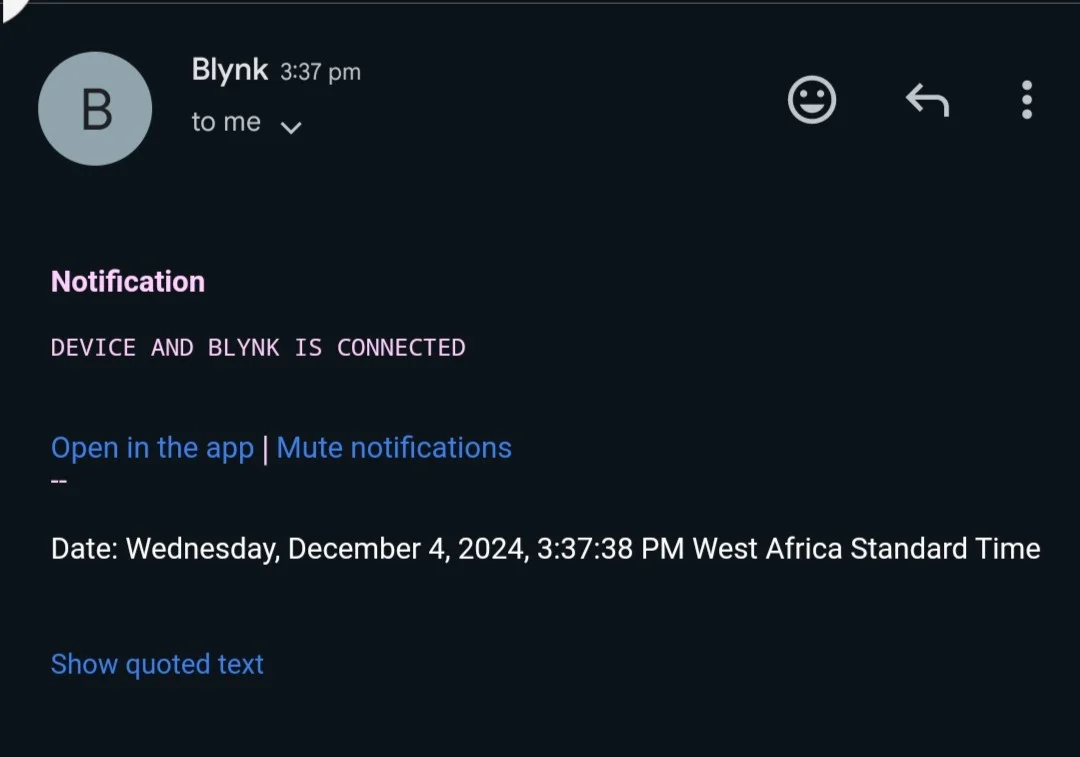
Notification for When an Event Happens
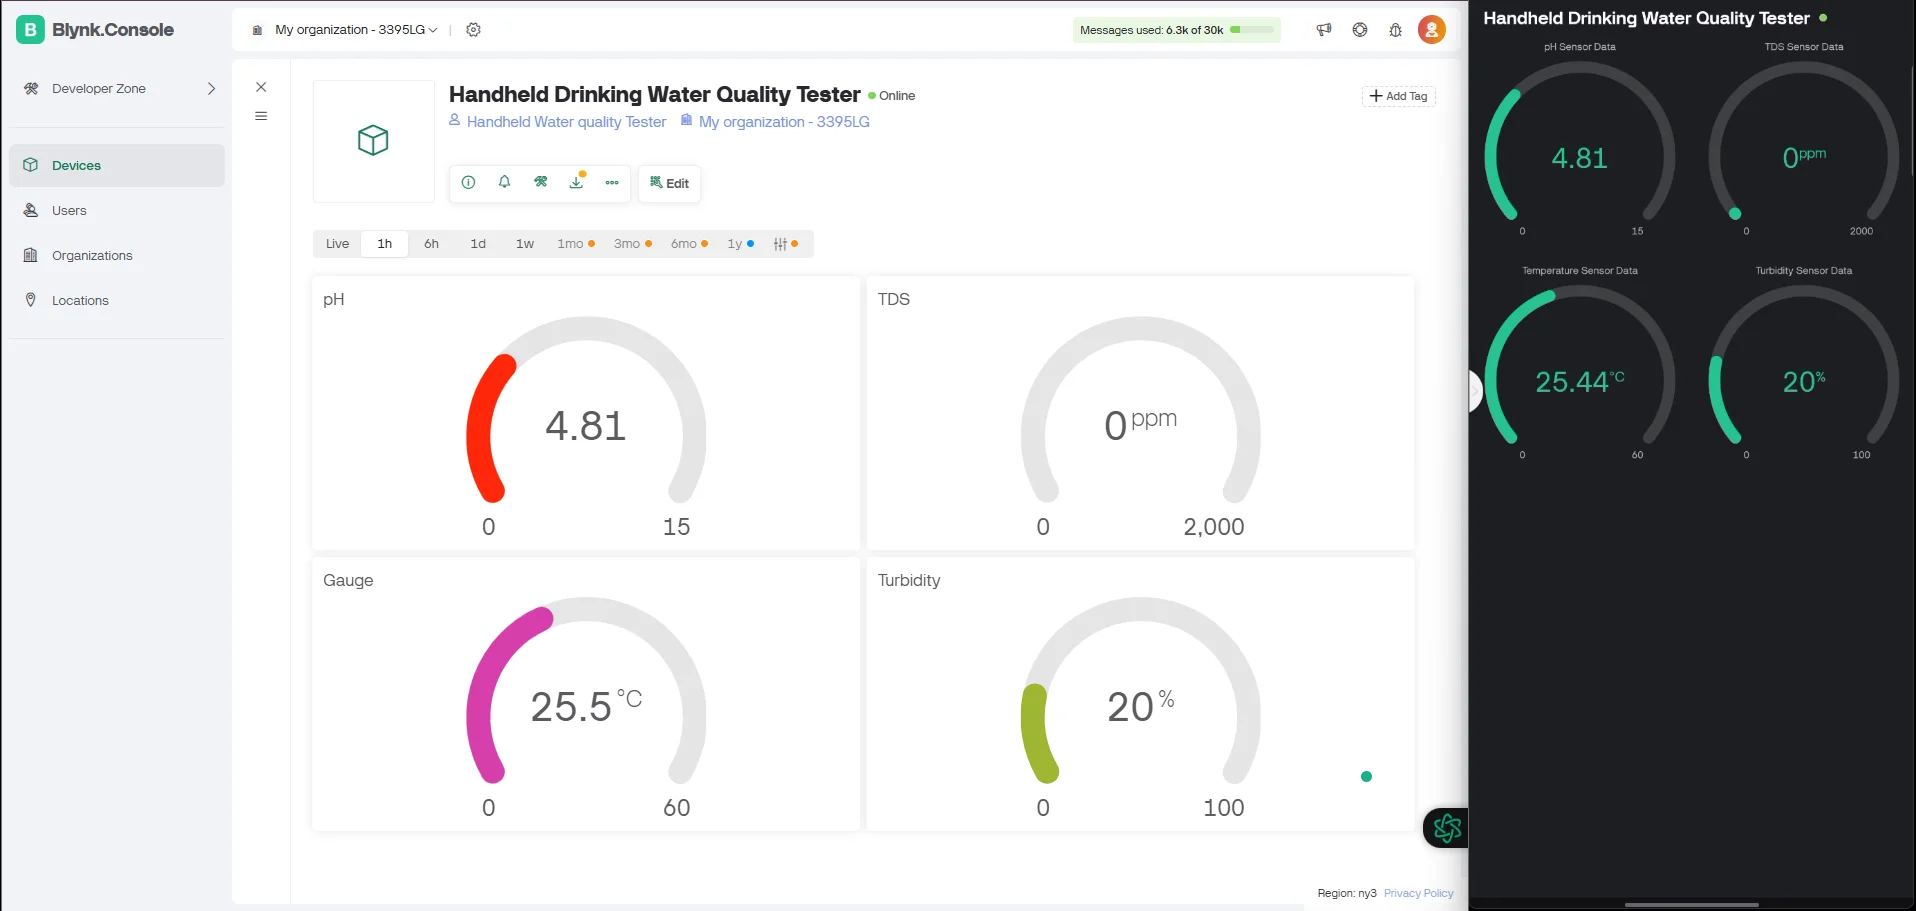
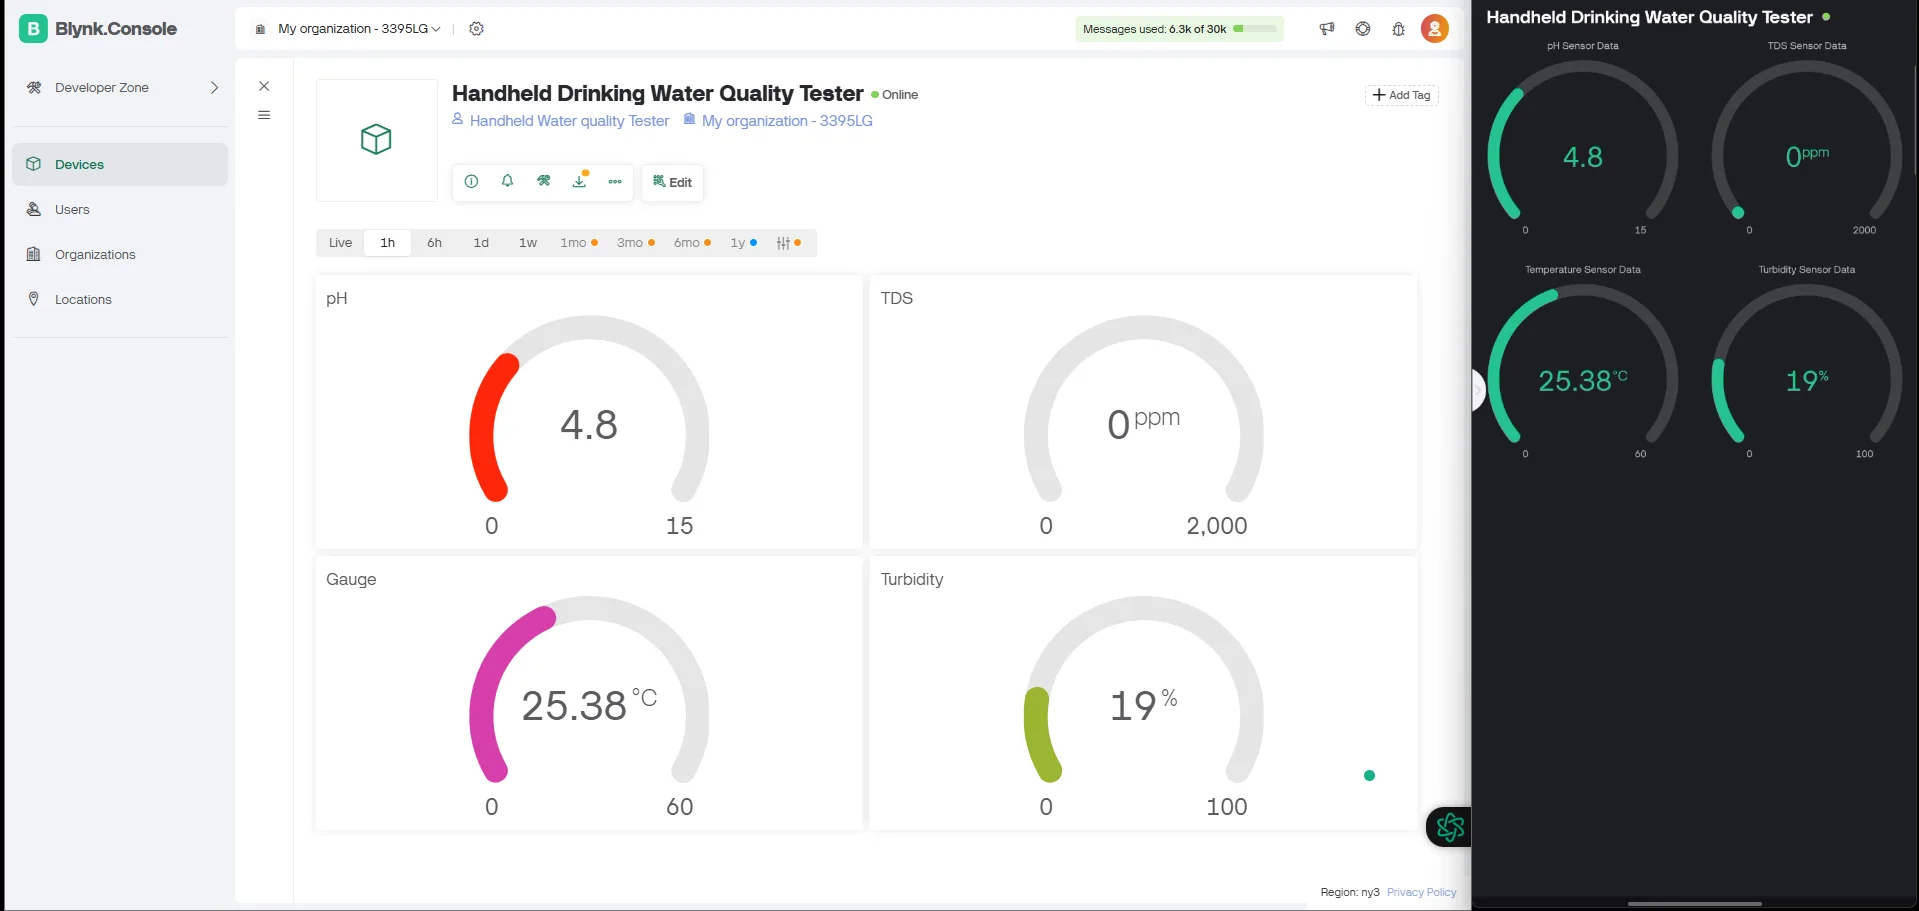
BLYNK Web and Mobile Application Real-Time Integration
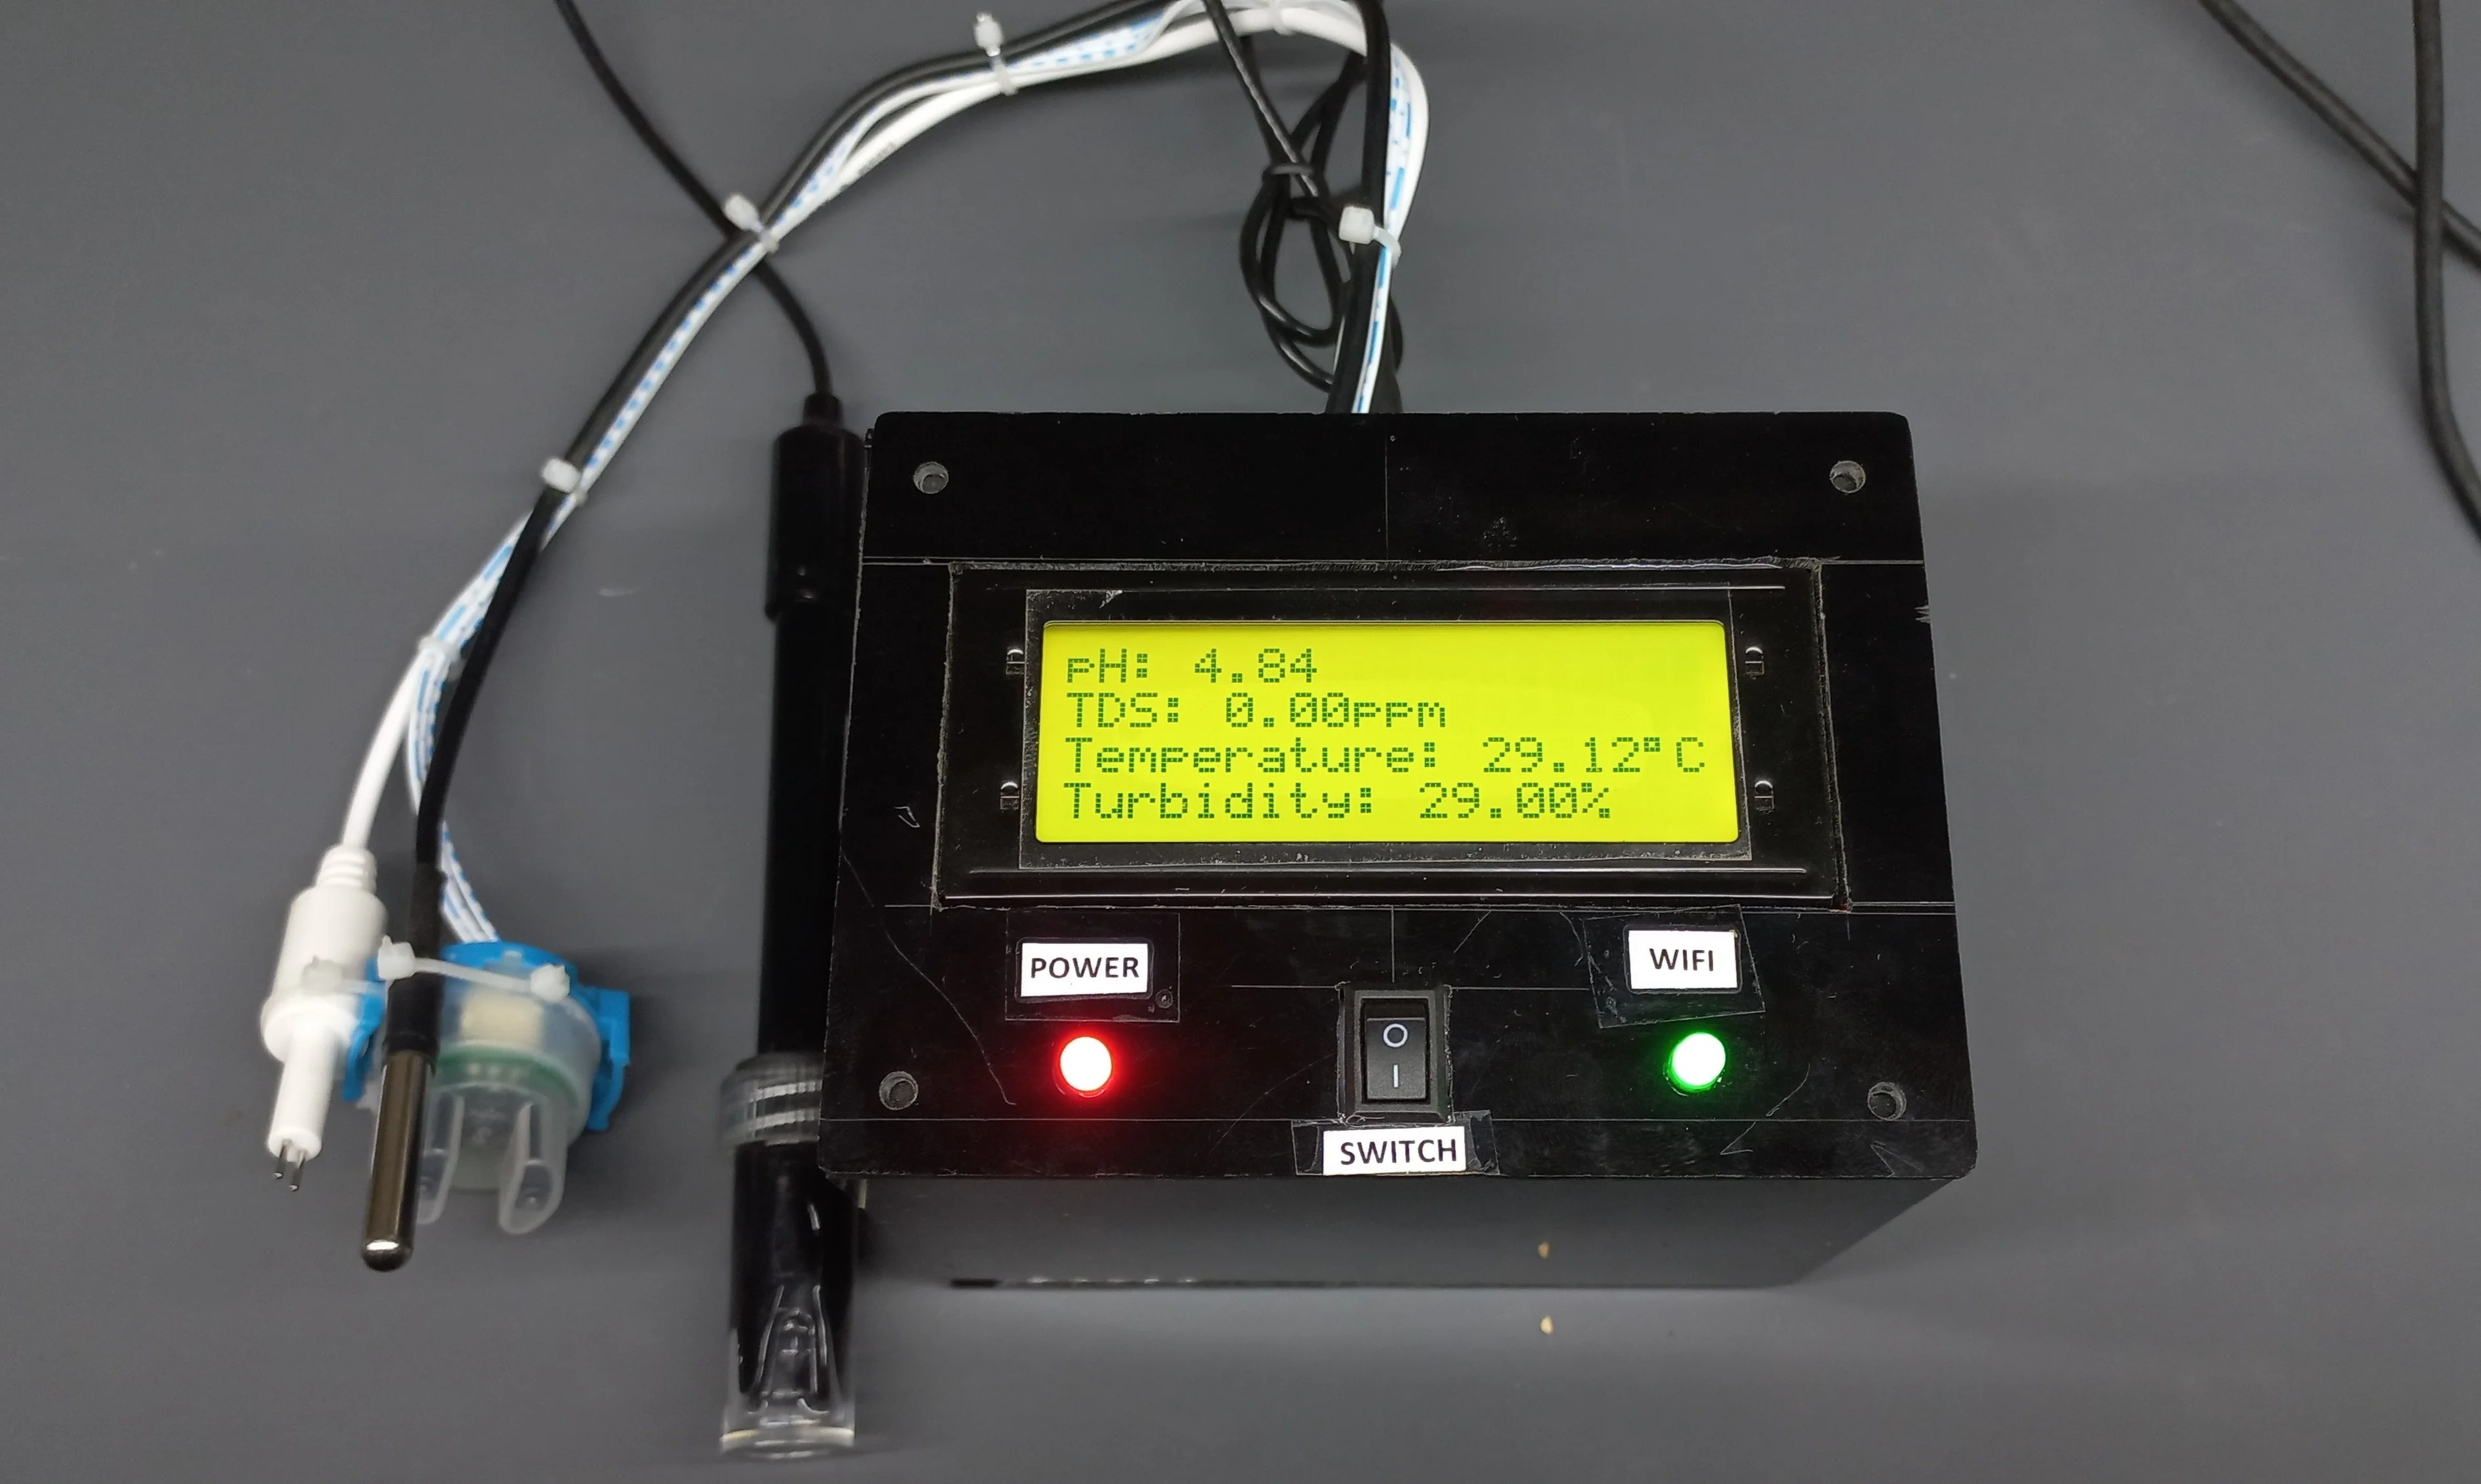
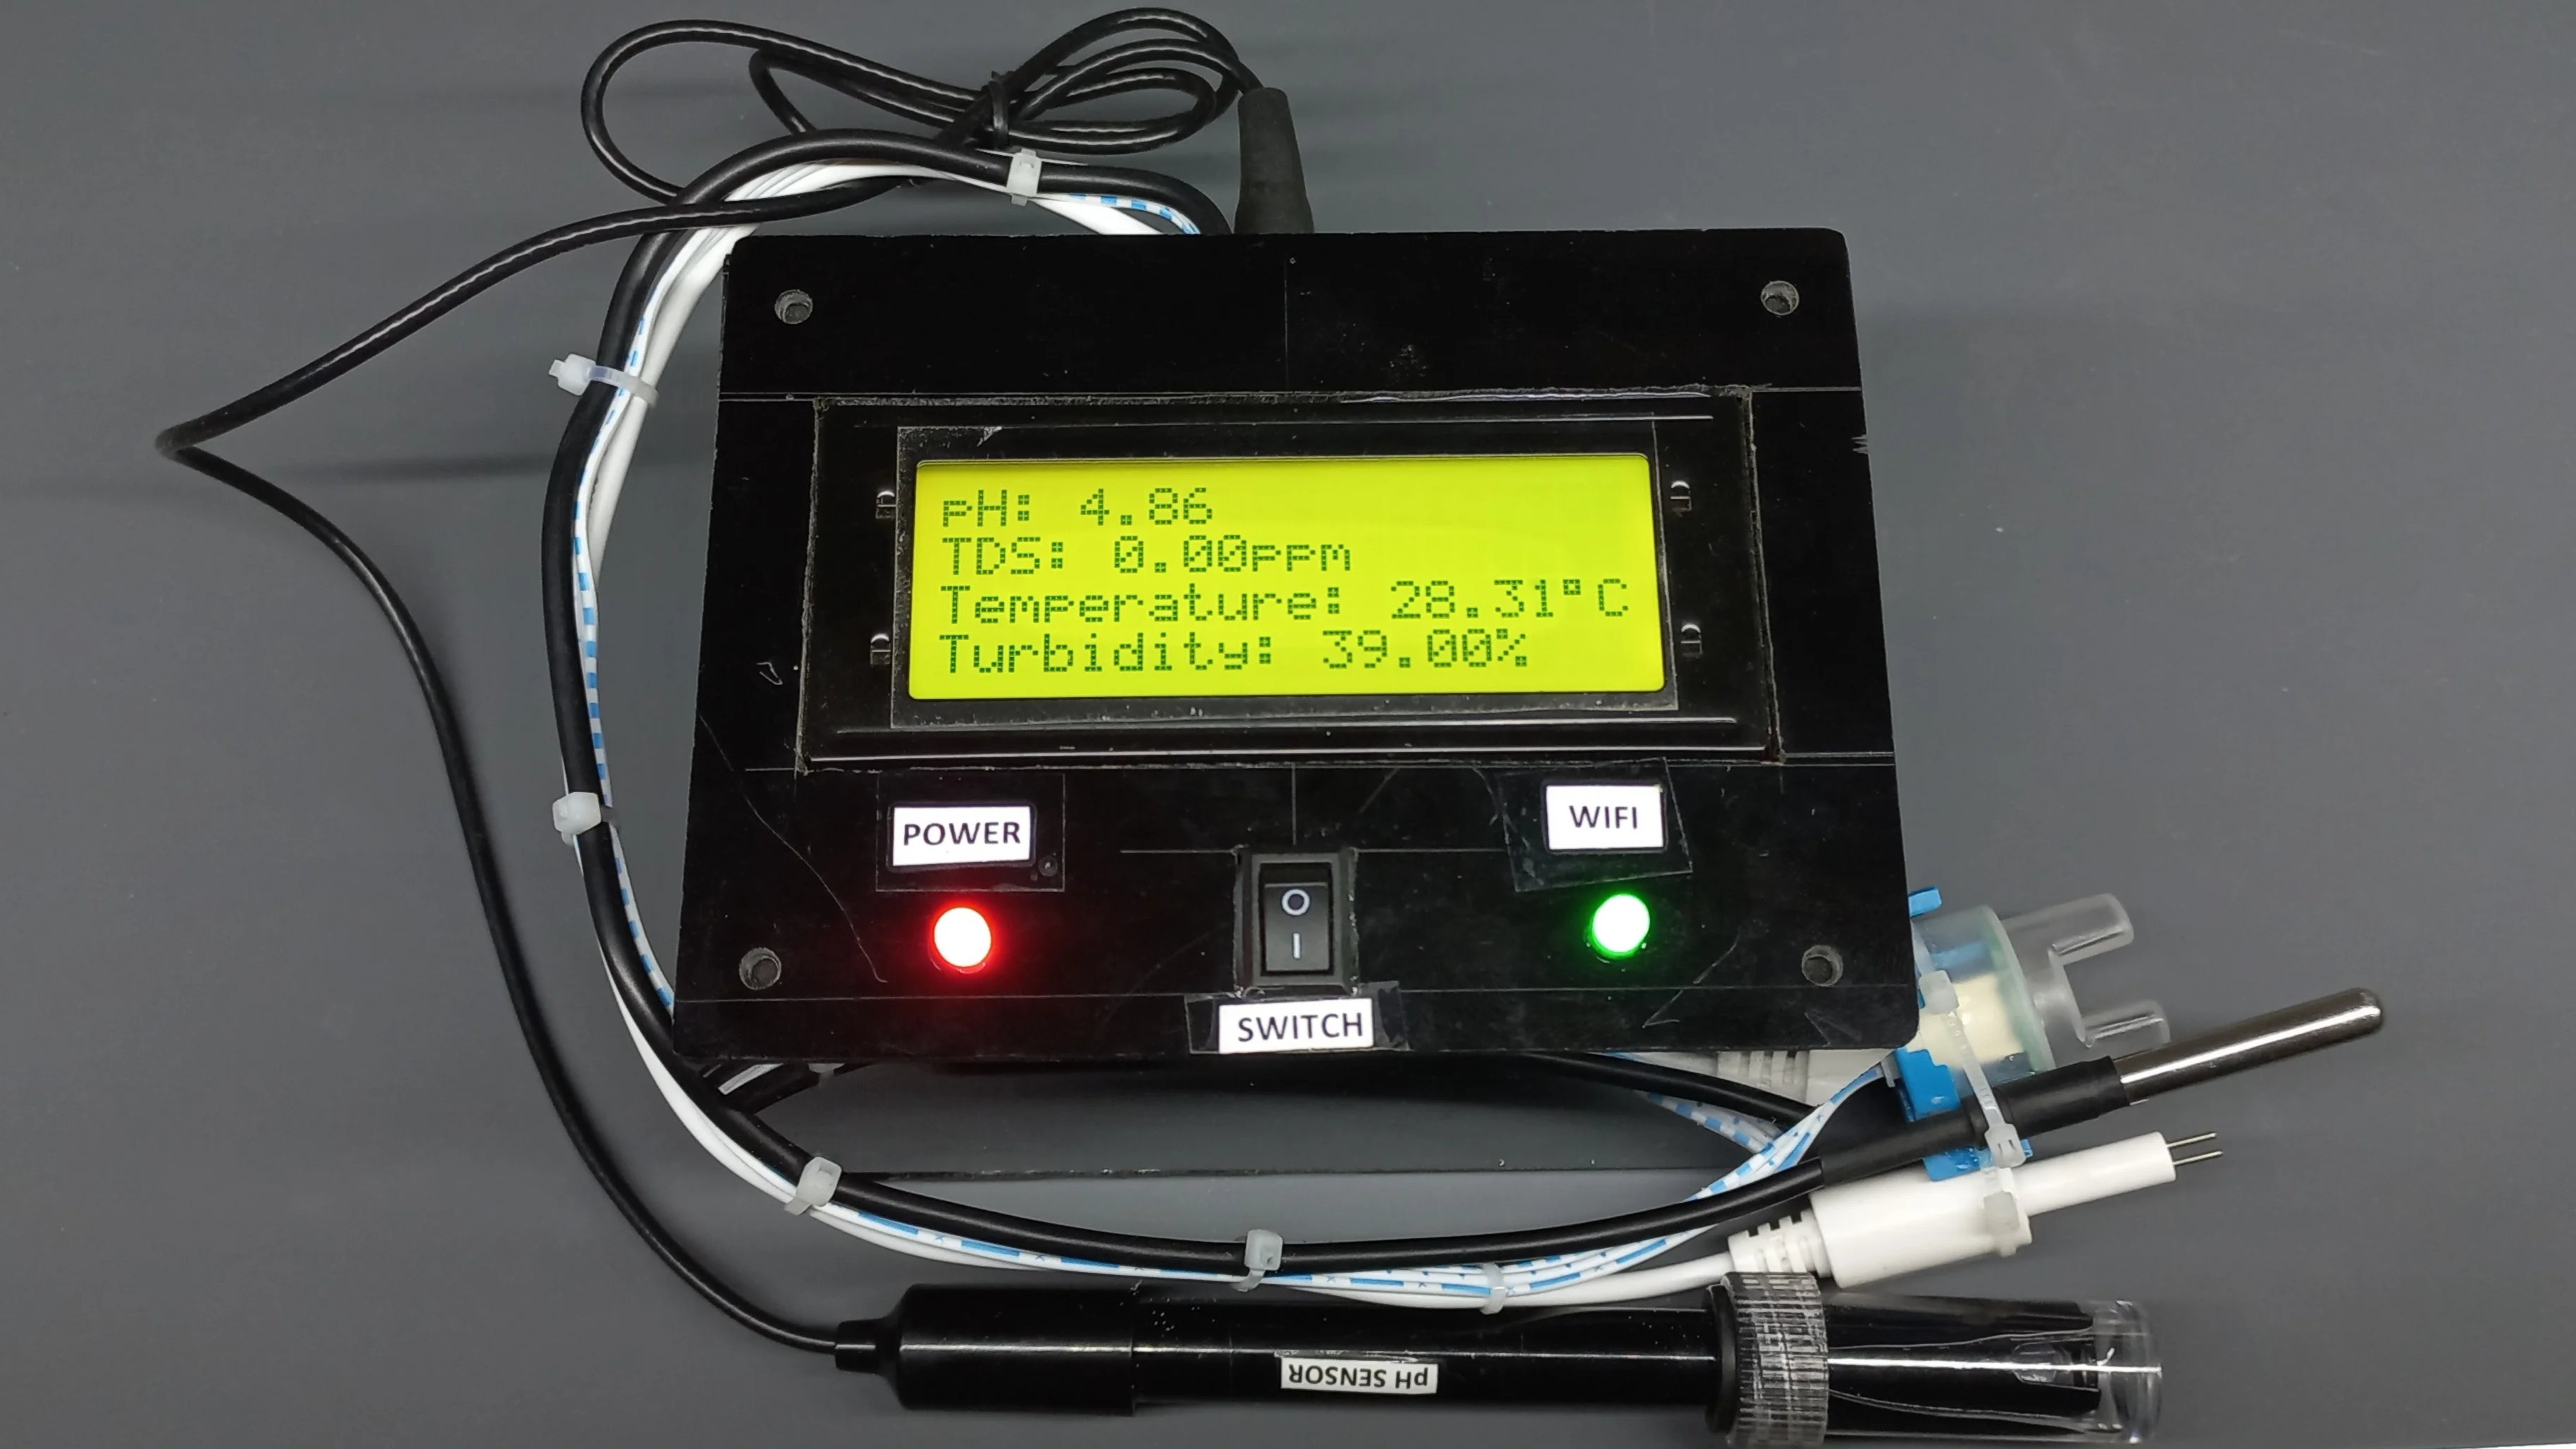
LCD Result Displayand Mobile Application Real-Time Integration
What I Learned
- Advanced sensor integration and calibration techniques
- Integration of cloud-based databases for real-time data management.
- Practical considerations in hardware-software integration for portable devices.
Demonstation / Access
- GitHub Repository (for code & others): Click here!
- Live Demonstation Video: Watch on YouTube (Coming Soon)
Demo video placeholder (will be updated when available):
Circuit Diagram
Code Snippet
Future Enhancements
- Add support for additional water quality parameters like nitrates and chlorine.
- Integrate solar charging for off-grid usage.
- Enhance mobile app features with AI-driven analytics for predictive insights.
Thank You for Visiting My Portfolio
I sincerely appreciate you taking the time to explore my portfolio and learn about my work and expertise. It is my hope that these projects and insights have demonstrated my passion for innovation, my technical skills, and my dedication to delivering impactful solutions.
If you have any questions, require further information, or wish to discuss potential collaborations, I would be delighted to connect. Please feel free to reach out via the Contact section. Your feedback and inquiries are highly valued and will be addressed promptly.
Thank you once again for your interest in my work. I look forward to the opportunity to collaborate and contribute meaningfully to your projects or organization. Together, let us innovate and achieve excellence.
Best regards,
Damilare Lekan, Adekeye.